Executive summary
This U4 Issue builds on U4’s 2020 publication Corruption and climate finance: Implications for climate change interventions, by analysing new and emerging challenges and risks related to corruption and climate finance. From an anti-corruption perspective, the urgency for such an evaluation is driven by the exponential growth in climate finance. In 2018, climate-related investments were US$546 billion; that increased 230% to US$1.27 trillion in 2021–2022. Climate finance (CF) is evenly divided between public and private sources.
This report includes the most recent authoritative data on global climate finance and climate-related development finance, and the most recent indices for corruption and governance. The research confirms that corruption and inconsistent integrity controls in CF are ongoing problems. In particular, climate-related investments – public and private – continue to flow into some of the riskiest jurisdictions on earth from an integrity perspective. In the case of producers of minerals critical for the energy transition, climate-related investments – such as for lithium and nickel mines – are expanding, despite limited progress on reducing corruption in many producer countries. This is because climate investments are not always allocated for climatic reasons, but rather according to political and economic considerations and for potential profits.
The increase in climate investments is creating new and emerging challenges, including:
- Influx of private sector capital which is subject to inconsistent integrity controls
- Intensifying need for alignment of private and public sector anti-corruption controls
- corruption risks posed by burgeoning government subsidies for investments in renewable energy
- Escalating pressure to allocate mining or renewable energy infrastructure to land used or owned by communities that are frequently already marginalised
- Intensifying threats from organised crime networks that are infiltrating the climate domain.
Until these challenges are clearly understood and evidenced-based anti-corruption responses are put in place, the likelihood of a ‘just transition’ to net zero – one that leaves poorer communities better off rather than worse off – will be jeopardised.
The report begins with an overview of the current patterns of CF, by recipient and sector. We look at the organisations providing CF, and highlight CF-related development finance that is also taking gender equity into account.
To illustrate some of the issues, Section 2 provides a comprehensive account of three major case study examples where corruption has infiltrated CF. Section 3 takes in some of the wider issues such as the role of politics in CF allocation, the role of mining for critical minerals, and other risks for corruption that will thwart a just transition to net zero.
Section 4 identifies new corruption risks and knowledge gaps that have emerged or intensified since 2020, including:
- The influx of private sector investments means inconsistent integrity controls, depending on the funds’ jurisdictional origin and destination.
- While private and public financers and developers could benefit by learning about each other’s integrity strengths, there is insufficient mutual learning occurring.
- Burgeoning risks around governmental ‘green subsidies’, which combine a mix of well-established and well-known risks for fraud with poorly understood risks around how corruption negatively impacts GHG emissions.
- Escalating pressures due to the urgency and scale of land appropriation for renewable infrastructure (such as wind or solar farms, or dams) or for mines for critical minerals. This is at odds with the notion of a ‘just transition’ as landowners and land users in these locations – who are frequently already marginalised – become further marginalised.
- Intensifying threats from organised crime networks that are infiltrating the climate domain as the profits available have grown.
Section 5 concludes with suggested priority areas for action, and crucial learning to fill knowledge gaps.
The report highlights key areas for action to overcome the challenges. For example, peer-to-peer learning mechanisms that span the public, private and non-profit sectors would help propagate lessons learned and best practice. Multilateral financial institutions – which function as banks but also understand developmental objectives – could communicate environmental, social and governance (ESG) and corruption risks to private banks and investors. Greater cooperation between national and international policing authorities and anti-corruption stakeholders, would lead to more prosecutions and create a deterrent to corruption in CF. Also, more research is needed to establish an evidence base for sound anti-corruption policy and controls.
The rise of climate finance and its corruption problem
Climate finance (CF)01e7308e6636 reached US$1.27 trillion in 2021–2022 and is set to grow exponentially if donor commitments are fulfilled and anticipated private investment opportunities are created. CF is evenly split between public sources (US$638 billion) and private sources (US$626 billion), although private sources are expected to grow much faster than public sources. They need to do so if climate action is to contain global warming to 1.5°C above pre-industrial levels.86b6e3961c7b Most CF is focused on mitigation initiatives (US$1.15 trillion; 91.3%), with adaptation initiatives receiving US$63 billion (5.0%), and dual-use initiatives US$51 billion (3.5%).bc15865b491d
But CF has a corruption problem. This was established by U4’s 2020 publication, Corruption and climate finance: Implications for climate change interventions.1b40a5525e12 This current report builds on the previous research and provides an update on the evolution of CF-related corruption and the controls needed in light of these ever-growing investments. This report reconfirms that risks for corruption in CF remain significant. Yet they are inadequately managed and are creating emerging risks and new challenges. An important issue is that major destinations remain some of the riskiest places on earth from an integrity perspective. Major sources of CF – including members of the Global North and China – also have integrity weaknesses, especially around transparency. Implementing integrity controls is crucial to achieving a just energy transition that reduces marginalisation and inequity.For example, improved transparency in the financial sector will be critical due to burgeoning private finance.
Why does CF continue to be invested in risky destinations? The answer is that CF is frequently allocated based on non-climatic factors, and not solely to reduce greenhouse gas (GHG) emissions (mitigation), or reduce vulnerability to climate change (adaptation needs). Rather, a key driver is politics, including ‘push’ factors from the Global North and China that result in investments in producers of critical minerals, despite this industry’s weaker corruption controls. Other drivers are ‘pull’ factors from the Global South, where some countries have secured a ‘piece of the CF pie’, even though their potential for emissions reduction and vulnerability to climate change may not be significant in global terms. CF has rapidly evolved into a market where jurisdictions compete for investment. Some countries obtain CF despite corruption, but others fail to attract CF because of corruption.
Areas for action are highlighted in this report to help overcome these challenges. Key points include the need for more research into which controls can generate an evidence base for good policy. Peer-to-peer learning mechanisms – especially those that span the public, private and non-profit sectors – would help in this regard. Some that already exist are mentioned in this report. Multilateral financial institutions function as for-profit banks and frequently understand the purpose and ethos behind international development priorities (such as the Sustainable Development Goals). They could play a helpful role in communicating ESG risks to private investors who may need a better understanding of these concerns. Also, given the transnational nature of climate initiatives, and organised crime networks that may seek to become involved for profit, greater cooperation with policing authorities could strengthen investigations and prosecutions, and create a stronger deterrent.
This report uses the same research approach as U4’s 2020 report: analysing CF data to understand sources, destinations and volumes, and whether these flows correlate with jurisdiction-level variables related to GHG emissions, corruption and governance.
Our sources are the latest global CF data published by the Climate Policy Initiativeb44a27e3066f and the subset of climate-related development finance (CRDF) published by the Organisation for Economic Cooperation and Development.f4a032eacc10 Total CRDF in 2021 was US$97.5 billion (7.7% of the global CF 2021–2022 total). Since the 2020 report, CF-related data has improved in its comprehensiveness, clarity around the descriptions of categories used and the methodological notes that explain assumptions and gaps. One aspect that remains unchanged is that CF data remains surprisingly under-analysed in literature related to corruption.
The main sources of governance data used in this report are the latest corruption indices published by the World Bank and Transparency International, and data on transparency in governance published by the European Research Centre for Anti-Corruption and State-Building’s Transparency Index (T-Index) in 2023.
Three case studies highlight how unmanaged risks for corruption can cause CF-funded initiatives to fail to achieve their climate-related objectives. New political and economic developments around renewable energy and critical minerals are analysed to understand how they are driving changing patterns of CF, and the integrity risks associated with these changes.
1. Current patterns of climate finance
This section analyses current patterns of CF, based on the CRDF subset in the OECD’s Overseas Development Assistance (ODA) data from 2021, and global CF from Buchner et al. (2023a). It assesses the integrity profile of recipients and donors to understand the scale of corruption risks in these jurisdictions and compares this to recipients’ vulnerability to climate change. The assessment is based on scores from three integrity-related global indices: the World Bank’s Control of Corruption index (COC); the European Research Centre for Anti-Corruption and State-Building’s Transparency Index (T-Index), as developed by Alina Mungiu-Pippidi; and Transparency International’s Corruption Perceptions Index (CPI). Scores for vulnerability to climate change are from the Notre Dame Global Adaptation Initiative (ND-GAIN) Index.4ee43e211a17
Destination by recipient
As shown in Table 1, the top recipients of CRDF are at risk of corruption, and therefore risky places for climate-related investments (whether public or private). They are all also moderately to significantly vulnerable to climate change, with Turkey being the least vulnerable, and Bangladesh and Pakistan being most the vulnerable.
|
All recipients (LDC, LMIC, UMIC*) |
CRDF, millions (2021) |
% of total CRDF** |
Vulnerability, 2021 (0=not vulnerable, 1=very vulnerable) |
COC, 2022 (-2.5=highly corrupt, 2.5=very clean) |
T-Index, 2021 (0=not trans., 100=very trans.) |
CPI score, 2023 (0=highly corrupt, 100=very clean) |
|
1. India |
7,942.7 |
8.1 |
0.498 |
-0.32 |
60 |
39 |
|
2. Turkey |
3,505.3 |
3.6 |
0.353 |
-0.47 |
60 |
34 |
|
3. Bangladesh |
3,325.3 |
3.4 |
0.531 |
-1.08 |
53 |
24 |
|
4. Colombia |
2,757.4 |
2.8 |
0.414 |
-0.36 |
88 |
40 |
|
5. Egypt |
2,714.2 |
2.8 |
0.420 |
-0.68 |
38 |
35 |
|
6. Indonesia |
2,506.7 |
2.6 |
0.440 |
-0.43 |
78 |
34 |
|
7. Pakistan |
2,301.4 |
2.4 |
0.521 |
-0.80 |
70 |
29 |
|
8. China |
2,117.6 |
2.2 |
0.387 |
0.02 |
63 |
42 |
|
9. Argentina |
1,762.3 |
1.8 |
0.384 |
-0.45 |
85 |
37 |
|
10. Philippines |
1,759.6 |
1.8 |
0.463 |
-0.54 |
70 |
34 |
|
Total |
30,692.5 |
31.5% |
|
|||
* LDC: least-developed countries; LMIC: lower-middle-income countries; UMIC: upper-middle-income countries.
** Total CRDF in 2021 was US$97.5 billion.
Sources: CRDF: OECD 2021; Vulnerability to climate change: Chen et al. 2023; Control of Corruption (COC) Index: World Bank 2023a; T-Index: Mungiu-Pippidi 2023; and Corruption Perceptions Index (CPI): Transparency International 2023.
Three of the top ten recipients – Colombia, Indonesia, and Argentina – do well for transparency in government (T-Index), which may assist policymaking and progress towards a just transition. However, the country that scores best for anti-corruption – as measured by either the COC or CPI – is China, and its T-Index score also marks it as only moderately transparent relative to other countries. All other countries have moderate to low scores for the COC and CPI indices. Of the top ten, India is distinctive: it is the top CRDF recipient (US$7.8 billion, 8.1% of total CRDF), receiving more than double the next largest recipient (Turkey; US$3.5 billion). However, India scores only in the moderate range across all three integrity indices.
The profile of least-developed country (LDC) recipients of CRDF is different to the largest global top ten CRDF recipients. LDC recipients are much poorer, have smaller economies, are far more vulnerable to climate change, and most have severe corruption problems (see Table 2).
|
Least- developed country |
CRDF, millions (2021) |
% of total CRDF** |
Vulnerability, 2021 (0=not vulnerable, 1=very vulnerable) |
COC, 2022 (-2.5=highly corrupt, 2.5=very clean) |
T-Index, 2021 (0=not trans., 100=very trans.) |
CPI score, 2023 (0=highly corrupt, 100=very clean) |
|
1. Bangladesh |
3,325.3 |
3.4 |
0.531 |
-1.08 |
53 |
39 |
|
2. Niger |
1,222.7 |
1.3 |
0.632 |
-0.59 |
n/a |
32 |
|
3. Ethiopia |
1,143.4 |
1.2 |
0.547 |
-0.44 |
38 |
37 |
|
4. Tanzania |
1,086.0 |
1.1 |
0.504 |
-0.34 |
55 |
40 |
|
5. DRC |
1,055.9 |
1.1 |
0.564 |
-1.54 |
48 |
20 |
|
6. Mozambique |
1,027.0 |
1.1 |
0.493 |
-0.84 |
43 |
25 |
|
7. Senegal |
848.8 |
0.9 |
0.520 |
-0.03 |
58 |
43 |
|
8. Burkina Faso |
841.0 |
0.9 |
0.537 |
-0.08 |
60 |
41 |
|
9. Mali |
651.0 |
0.7 |
0.596 |
-0.88 |
40 |
28 |
|
10. Madagascar |
598.5 |
0.6 |
0.557 |
-1.01 |
40 |
25 |
|
Total |
11,799.6 |
12.1% |
|
|
* Mali, Burkina Faso, and Niger are unlikely to be in the top ten list of least-developed country (LDC) recipients in 2024 or 2025 given donor cuts to Overseas Development Assistance (ODA) following military coups in these countries in 2021, 2022 and 2023, respectively. Notable absences from the 2021 top ten LDC recipient list are Yemen and Afghanistan –these countries were on the list in U4’s 2020 paper which also addressed jurisdictional integrity risks (Corruption and climate finance: Implications for climate change interventions). ODA to both countries was severely reduced for political reasons after 2020.
** Total CRDF in 2021 was US$97.5 billion.
Sources: CRDF: OECD 2021; vulnerability to climate change: Chen et al. 2023; COC: World Bank 2023a; T-Index: Mungiu-Pippidi 2023; and CPI: Transparency International 2023.
What is most striking about LDC recipients of CRDF (as shown in Table 2), is how vulnerable they are to climate change: only Tanzania and Mozambique are outside the ND-GAIN Index’s bottom quintile.101283c22f44 The other outstanding feature is how poorly these countries score for integrity. Senegal scores the highest for governance across all three indices, closely followed by Burkina Faso. However, their scores are merely moderate relative to other countries. Bangladesh, Democratic Republic of Congo (DRC), Mozambique and Mali, all score very poorly.
Statistical tests examined the relationship between vulnerability to climate change and the three integrity indices. The results found a significant, negative, correlation between vulnerability to climate change and governance – that is, weaker integrity in governance is highly likely to correlate with greater vulnerability to climate change. The figures in the Annex include scatterplots of vulnerability to climate change, the three integrity indices (COC, T-Index and CPI), and the results of statistical tests for these datasets.d987efc87f56
The data in Tables 1 and 2 suggest that there is much potential for action on integrity among the top recipients of CRDF, given their weak scores on governance indices. However, the scope, scale and nature of integrity-strengthening programmes that could be applied to climate initiatives becomes more complicated when CF is viewed more globally – and beyond development finance. Flows of global CF beyond CRDF are shown in Table 3 (which disaggregates CF by geographic region), and the relationship between these global CF flows and vulnerability to climate change are shown in Figure 1 (a scatterplot of 142 countries).
Table 3: Global climate finance (CF) (domestic and international) by region of destination*
|
Region |
CF, millions (2022) |
% of total CF (2022) |
|
East Asia and Pacific (incl. China, Japan, Indonesia, the Philippines) |
660 |
46.7 |
|
Western Europe (incl. Netherlands) |
338 |
23.9 |
|
US and Canada |
190 |
13.4 |
|
Latin America and the Caribbean |
59 |
4.2 |
|
South Asia (incl.India, Pakistan, Bangladesh) |
50 |
3.5 |
|
Central Asia and Eastern Europe (incl. Turkey) |
36 |
2.5 |
|
Sub-Saharan Africa |
34 |
2.4 |
|
Middle East and North Africa |
20 |
1.4 |
|
Other Oceania (incl. Australia) |
15 |
1.1 |
|
Transregional |
12 |
0.8 |
|
Total |
1,414** |
99.9 |
(Selected countries are in parentheses)
* Buchner et al. (2023a) do not disaggregate their data by country, but the countries included in each region are listed in their methodology report (Buchner et al. 2023b).
** The reported CF global total for 2021–2022 is US$1,265 billion (Buchner et al. 2023b). As explained in their methodology report, this figure is based on biennial averages (taken to ‘smooth’ the data). Buchner et al. also provide data annually (see Table A1 in Annex I: Data Tables, p.43, 2023a). The reported total for 2022 is US$1,415 billion, which is used for Table 3.
Source: Table A.10, Buchner et al. 2023a: 47.
Figure 1 is a scatterplot of 142 countries, with the following countries shown for reference: the least transparent (Haiti); the most climate vulnerable (Chad); top LDC recipients with large populations (DR Congo and Ethiopia); large Western European economies (France, Spain, UK, Germany, and Italy); and the US and Canada. Also shown are top CRDF recipients, including India, Turkey, Bangladesh, Indonesia, Pakistan, and the Philippines. As can be deduced from Table 3, the top CRDF recipients are not significant in terms of global CF. This because global CF is skewed towards wealthier countries with large economies, rather than those countries where climate vulnerability is highest.b5353961cf8e
Figure 1: Scatterplot of Vulnerability to Climate Change and T-Index scores (n=142)*
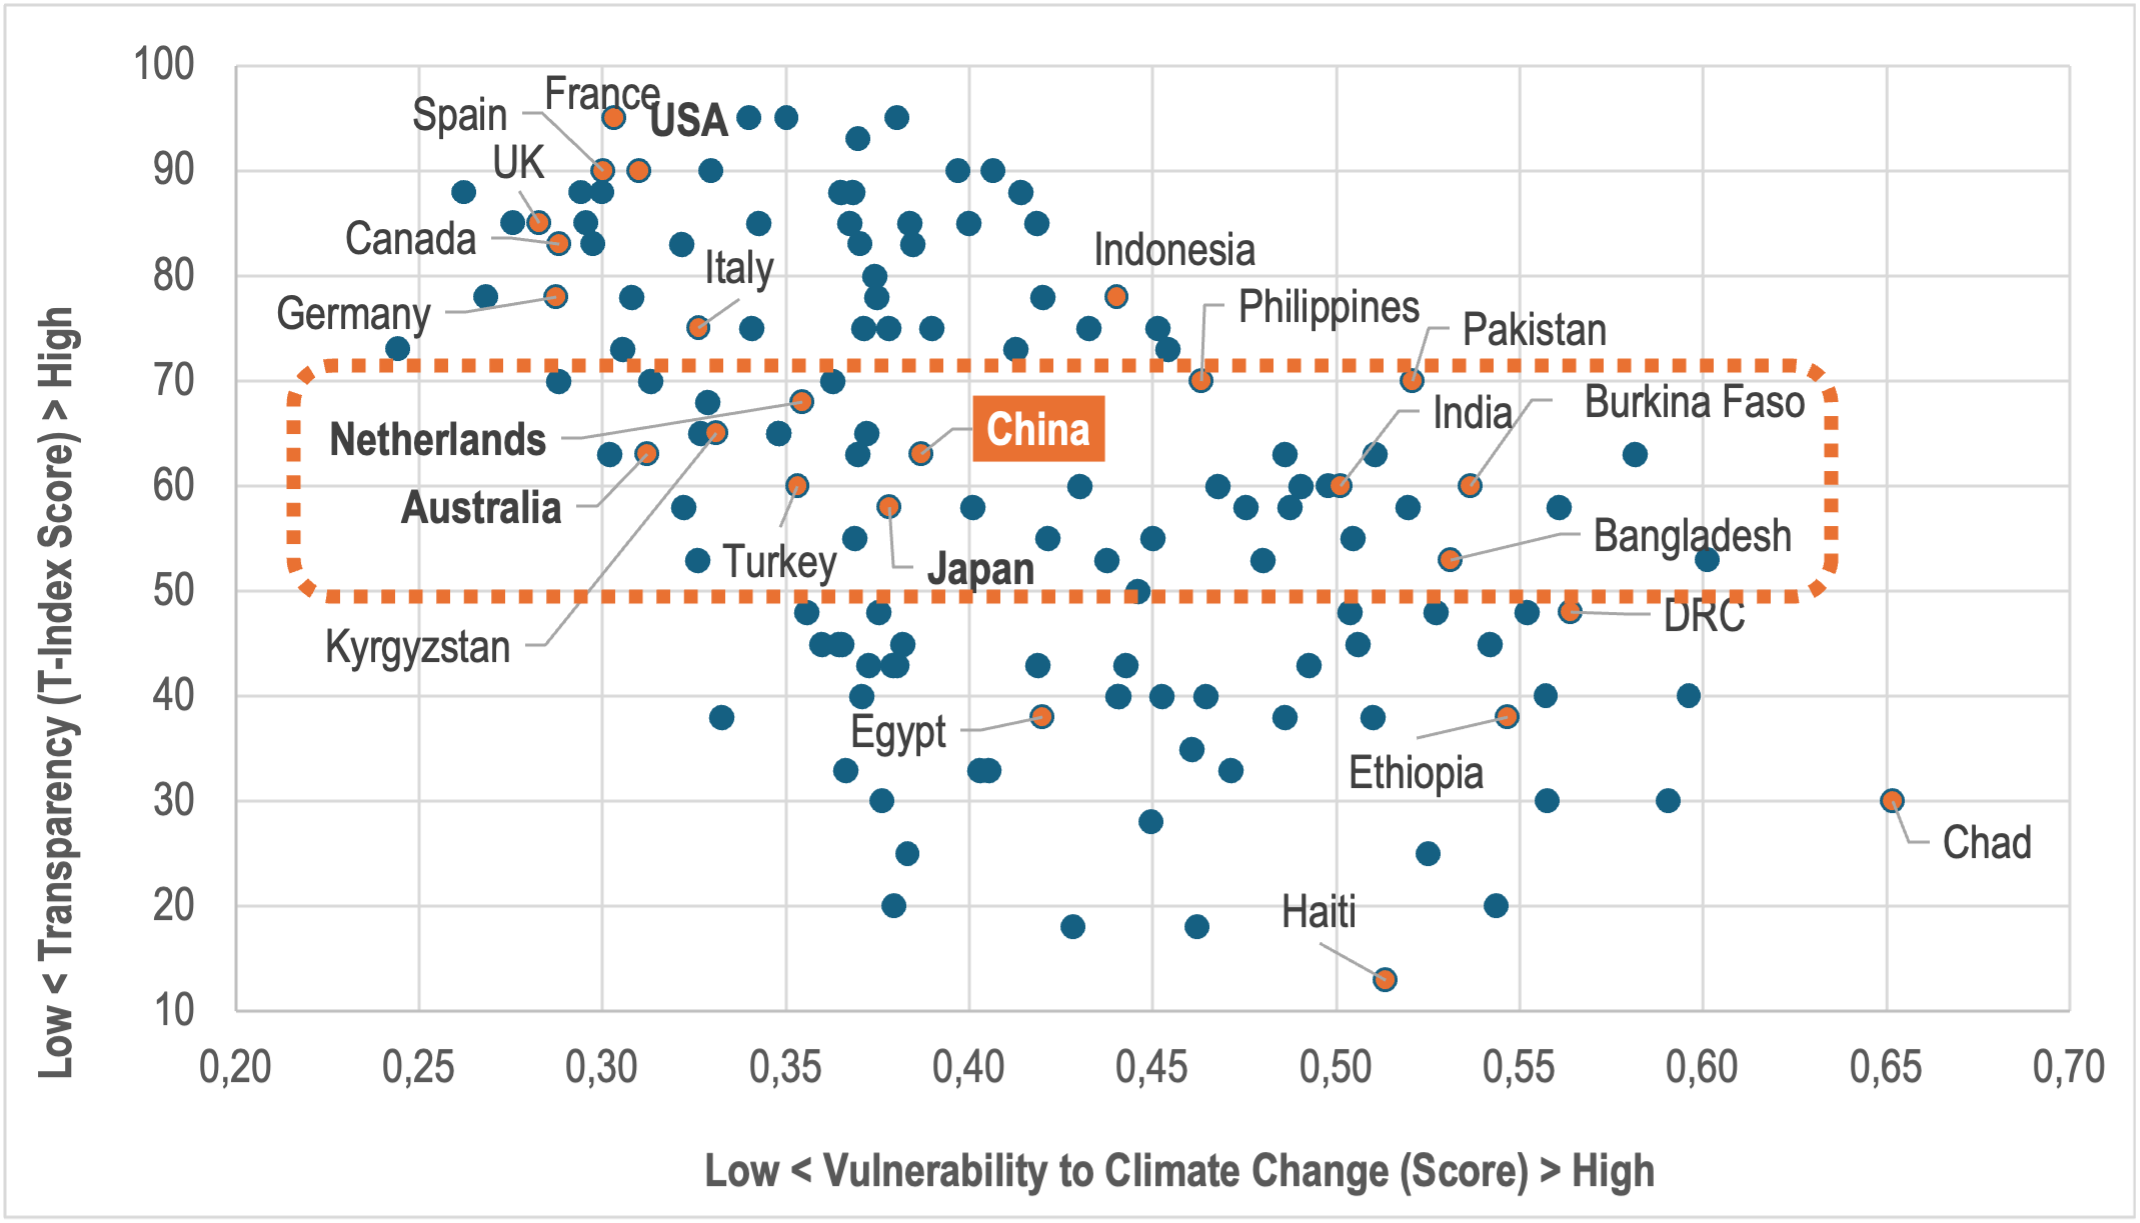
Top CRDF recipients are coloured orange.
* Figure 1 is the same as Figure A.3 in the Annex, except the latter does not show the selected countries.
Sources: Chen et al. 2023 and Climate Policy Initiative 2023.
What is notable in Figure 1 is the presence of China, Japan, Australia, and Netherlands within the orange rectangle (which indicates a band of countries with moderate transparency). Buchner et al.9143fbf525e6 show that China’s domestic CF mobilisation accounts for 51% of all domestic CF globally, approximately US$542 billion. This means that China’s share of East Asia and Pacific in Table 3 is a minimum of 82%, which makes China the destination for more global CF than any other country – at least 38.3% – even before international flows are taken into account. (Japan, Indonesia and the Philippines, and the rest of East Asia, collectively provide a maximum of only 8.3% in global CF.) China’s interest and investment in renewable energy is corroborated by Global Energy Monitor, a non-governmental organisation (NGO), which monitors energy infrastructure data. It found that, in 2024, China was home to 64% of all large-scale solar and wind power infrastructure under construction globally.73c9ea12bbb5
Although dwarfed by CF investments in China, Japan must have some significance as a destination and origin of CF globally, given the size of its economy; Australia is the world’s 12th largest economy and the 16th largest GHG emitter; and the Netherlands is the world’s 18th largest economy and a significant global financial hub.0e038ec214af Yet, as shown in Figure 1, China, Japan, Australia and Netherlands all score only moderately for transparency: Japan is lower than Burkina Faso; Australia is lower than Kyrgyzstan; and all four countries score lower than Indonesia, Pakistan and the Philippines.
Basic transparency around CF has been flagged as a problem in terms of limitations on the availability and clarity of CF data to understand CF sources and recipients.de48f5f31f66 A second problem relates to transparency around governance of climate activities, including:
- Understanding and controlling undue influence
- Understanding how climate policy is made
- Ensuring a just transition.
Public engagement with multiple stakeholders, open discussion, and clear decision-making processes are critical for transparency around these issues.
Weaker transparency in China, Japan, Australia, and Netherlands – all large economies significant for the climate crisis and for global finance – suggests that there is scope for integrity action in developed countries, and in sources of CF, not just for its recipients. Based on Mungiu-Pippidi’s research into laws adopted by states on transparency (what she calls de jure transparency), compared to their actual implementation of these laws (what she calls de facto transparency), China, Japan, Australia, and Netherlands could improve their (de facto) transparency around law-making, public spending, and court processes.6ab47c80a103
The difference between China’s political and governance system and democratic systems, especially around transparency, also creates unknowns in policymaking, financial management, and legal processes and decisions. This should not necessarily be interpreted as corruption. China has corruption controls in place, including for the climate domain.925df9ea8638 However, because of China’s importance globally for GHG emissions, for climate action, and as a source and destination of CF, these unknowns reduce the ability to understand fully many aspects of the climate crisis – such as GHG emissions, progress on climate action, investment flows into new technology, the nature of new technology, application of integrity controls, and accountability for decisions.
Destination by sector
Table 4 shows that global CF is focused on three key sectors for mitigation purposes: Energy Systems (39.5% of global CF), Transport (28.8%) and Buildings & Infrastructure (18%). If the sectors’ share of adaptation and dual distributions (for both adaptation and mitigation purposes) are included, together they are the destination for 86.9% of global CF. Given that these sectors are all well-known for corruption risks,732ee9136a01 and knowing how much CF these sectors receive, the importance of targeted integrity controls is clear. Table 4 also shows that the Agriculture, Forestry, Other Land Uses, and Fisheries (AFOLU) sector of global CF is grossly underfunded, especially given the scale of need and large communities that derive livelihoods from agriculture, forestry and fishing. Forest communities (particularly Indigenous communities) also provide conservation and stewardship for forests that are carbon sinks. The underfunding of the AFOLU sector is even more alarming given: (a) the importance of the sector for LDCs, many of which are highly climate vulnerable; and (b) that support for livelihoods is essential for a just transition.
Table 4: Global climate finance by sector, 2022
|
Sector |
Mitigation |
Adaptation |
Dual purpose |
Combined CF |
||||
|
US$bn |
% |
US$bn |
% |
US$bn |
% |
US$bn |
% |
|
|
Energy Systems |
559.0 |
43.3 |
0.1 |
0.1 |
6.0 |
11.9 |
565.1 |
40.0 |
|
Transport |
407.0 |
31.5 |
1.0 |
1.4 |
1.0 |
2.0 |
409.2 |
28.9 |
|
Buildings & Infrastructure |
255.0 |
19.7 |
0.2 |
0.3 |
0.1 |
0.2 |
255.3 |
18.0 |
|
Waste |
20.0 |
1.5 |
- |
- |
0.4 |
0.8 |
20.4 |
1.4 |
|
Others & Cross-sectoral |
17.0 |
1.3 |
25.0 |
34.4 |
11.0 |
21.7 |
56.3 |
3.7 |
|
Industry |
14.0 |
1.1 |
0.1 |
0.1 |
0.1 |
0.2 |
14.2 |
1.0 |
|
Water & Wastewater |
10.0 |
0.8 |
39.0 |
53.6 |
3.0 |
5.9 |
52.0 |
3.7 |
|
AFOLU* |
7.0 |
0.5 |
7.0 |
9.6 |
27.0 |
53.3 |
41.0 |
2.9 |
|
Unknown |
2.0 |
0.2 |
0.1 |
0.1 |
2.0 |
4.0 |
4.1 |
0.3 |
|
ICT** |
1.0 |
0.1 |
0.2 |
0.3 |
0.0 |
0.0 |
1.2 |
0.1 |
|
Total US$ billions |
1,292.0 |
|
71.4 |
|
50.6 |
|
1,415.3 |
|
|
% of all CF |
|
91.3 |
|
5.04 |
|
3.5 |
|
99.9 |
* AFOLU: Agriculture, Forestry, Other Land Uses, and Fisheries.
** ICT: Information and Communications Technology.
Source: Buchner et al. 2023: 1.
Sectoral distribution of CRDF looks similar to global CF. However, riskier sectors receive a smaller proportion of investments, and the AFOLU sector receives a larger proportion compared to global CF (see Table 5).
|
Sector |
Mitigation |
Adaptation |
Dual purpose |
Combined CF |
||||
|
US$m |
% |
US$m |
% |
US$m |
% |
US$m |
% |
|
|
Energy |
13,876 |
14.2 |
753 |
0.8 |
1,523 |
1.6 |
16,152 |
16.6 |
|
Transport & Storage |
11,993 |
12.3 |
2,627 |
2.7 |
143 |
0.1 |
14,762 |
15.1 |
|
Water Supply & Sanitation |
2,606 |
2.7 |
5,481 |
5.6 |
967 |
1.0 |
9,054 |
9.3 |
|
Agriculture, Forestry & Fishing |
1,389 |
1.4 |
5,328 |
5.5 |
1,730 |
1.8 |
8,448 |
8.7 |
|
Other Multisector |
1,949 |
2.0 |
3,739 |
3.8 |
1,099 |
1.1 |
6,787 |
7.0 |
|
Government & Civil Society |
1,588 |
1.6 |
2,457 |
2.5 |
1,603 |
1.6 |
5,648 |
5.8 |
|
General Environment Protection |
1,685 |
1.7 |
1,565 |
1.6 |
2,371 |
2.4 |
5,621 |
5.8 |
|
Banking & Financial Services |
2,381 |
2.4 |
1,023 |
1.0 |
708 |
0.7 |
4,112 |
4.2 |
|
Other Social Infrastructure & Services |
391 |
0.4 |
2,653 |
2.7 |
350 |
0.4 |
3,394 |
3.5 |
|
Health |
215 |
0.2 |
2,317 |
2.4 |
394 |
0.4 |
2,926 |
3.0 |
|
Disaster Prevention & Preparedness |
258 |
0.3 |
2,358 |
2.4 |
28 |
0.0 |
2,644 |
2.7 |
|
Industry, Mining, & Construction |
1,483 |
1.5 |
434 |
0.4 |
137 |
0.1 |
2,054 |
2.1 |
|
Other sectors* |
1,915 |
2.0 |
2,862 |
2.9 |
614 |
0.6 |
5,390 |
5.5 |
|
Unallocated/unspecified |
8,247 |
8.5 |
422 |
0.4 |
1,836 |
1.9 |
10,483 |
10.8 |
|
Total US$ billions |
49,976 |
|
34,019 |
|
13,503 |
|
97,475 |
|
|
% of all CRDF |
|
51.2 |
|
34.7 |
|
13.7 |
|
100.1 |
* ‘Other sectors’ include Business & Other Services, Communications, Development Food Assistance, Donor Administration, Education, Emergency Response, General Budget Support, Other Commodity Assistance, Population Policies & Reproductive Health, Reconstruction Relief & Rehabilitation, Tourism, and Trade Policies & Regulations.
Source: OECD 2021.
The sectoral categories in Table 5 do not exactly match those from Buchner et al. as shown in Table 4. However, Energy (16.6% of total CRDF) and Transport & Storage (15.1%) are clearly the standout sectors within CRDF. If Industry, Mining, & Construction is added (2.1% of CRDF) to approximate the three top global CF categories, this means Energy, Transport & Storage, and Industry, Mining & Construction, receive 33.8% of all CRDF. Given that these three sectors are notorious for corruption – for example, bribery and kickbacks around permit and tendering processes, and fraudulent invoicing – the high proportion of CRDF directed to them is an area of concentrated risk. However, there is more risk in global CF, where 86.7% is directed to these sectors.
These three sectors are followed by Water Supply & Sanitation (9.3% of total CRDF) and Agriculture, Forestry & Fishing (8.7%), which are also the largest recipient sectors for adaptation projects. CRDF is distributed in small percentages across all other sectors. Unlike global CF, a greater proportion of CRDF is directed towards the AFOLU sector (8.7%, compared to 2.9% for global CF). This is an encouraging recognition by donors of the need for support to the AFOLU sector, although the proportion remains low. Integrity risks and potential corruption controls for this sector are better known, although they remain poorly managed. Also, corruption is systemic, especially in the Forestry subsector.f51dc6a54e6f
Providers of climate finance
Figure 2 shows the top ten providers of CRDF, as well as other provider types (with multiple providers bundled within each type). The World Bank is the standout provider (contributing 21.2% of all CRDF), followed by three OECD members (Germany, 9.7%; Japan, 8.6%; and France, 7.9%), then other Multilateral Development Banks (MDBs) or multilateral institutions. The top ten providers contribute 73.2% of all CRDF; other providers (bundled into the five ‘types’ listed below the top ten) contribute the remaining 26.8%.
Figure 2: Top providers* of CRDF, 2021 (US$ billions)
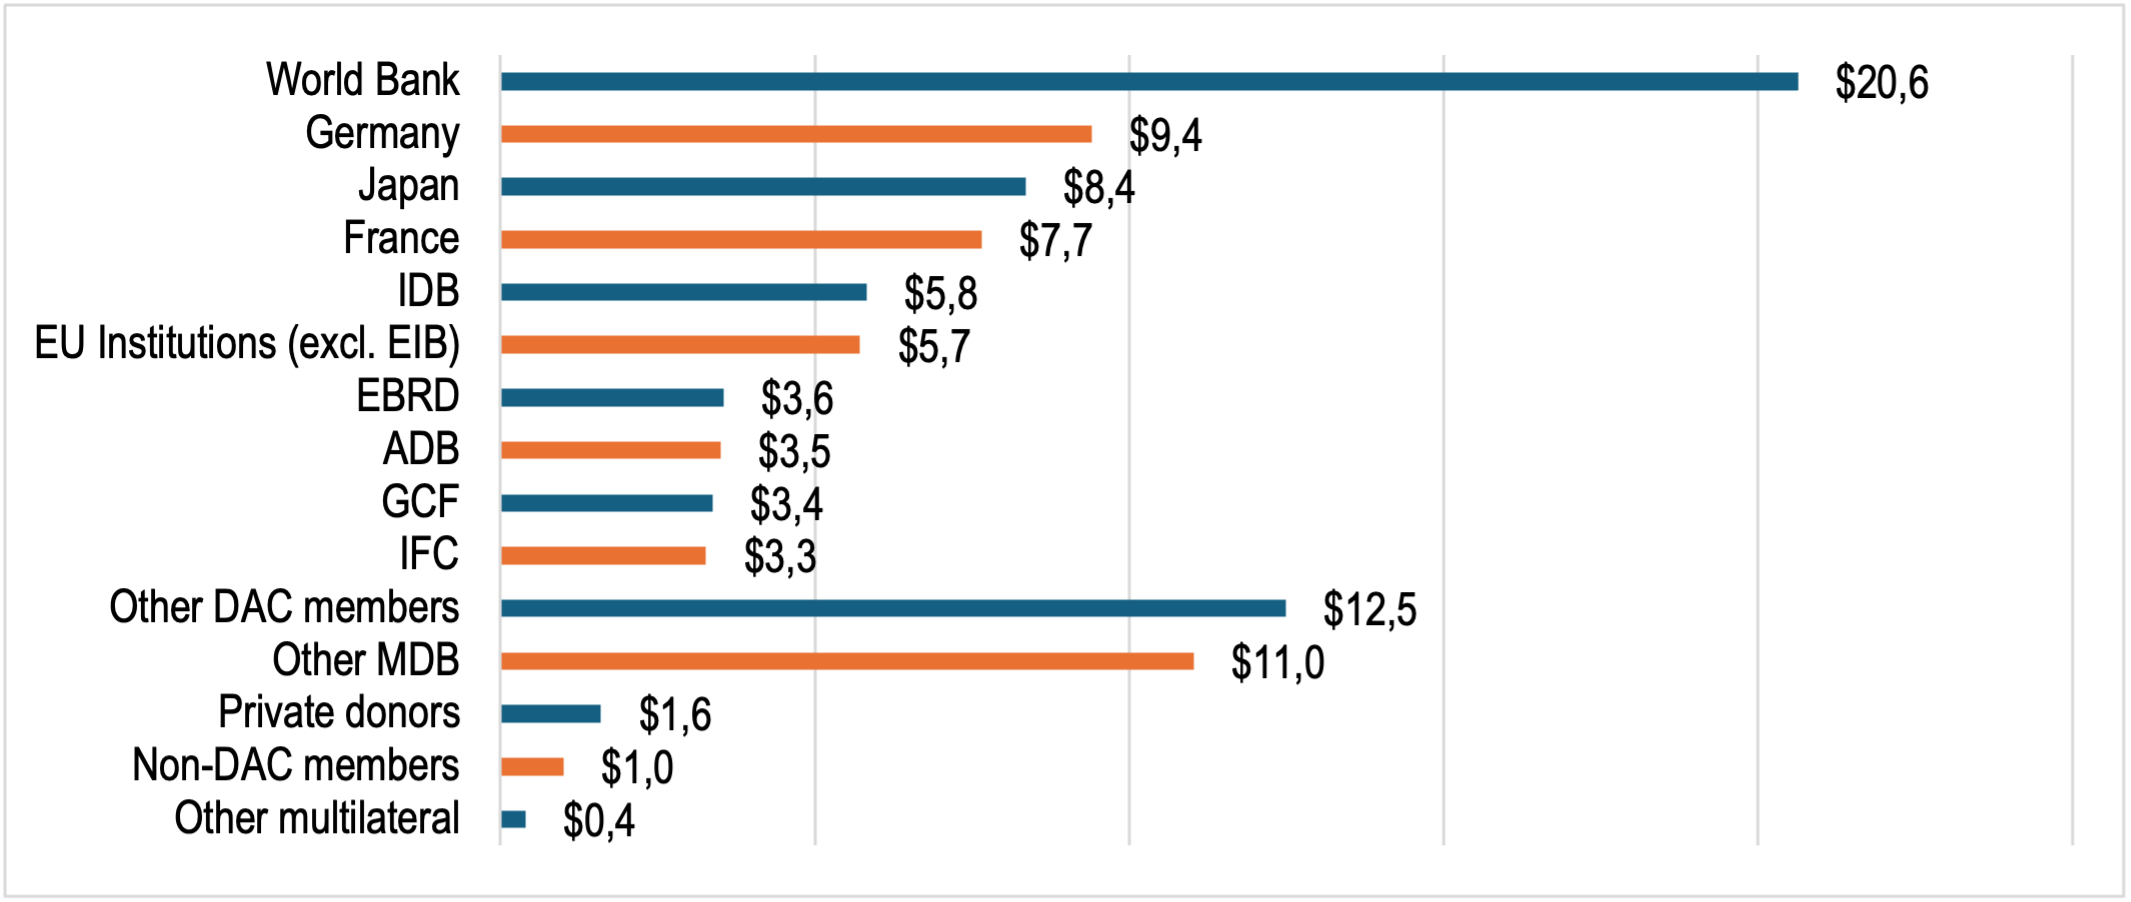
* IDB: Inter-American Development Bank; EIB: European Investment Bank; EBRD: European Bank for Reconstruction and Development; ADB: Asian Development Bank; GCF: Green Climate Fund; IFC: International Finance Corporation; DAC: Development Assistance Committee.
Source: OECD 2021.
The data in Figure 2 are encouraging from an integrity perspective because MDBs (including the World Bank) and most OECD members have integrity control programmes. They are also accountable to member states (in the case of MDBs), that are subject to scrutiny by civil society organisations (CSOs). Although their integrity programmes can always be strengthened, external pressures for accountability and transparency mean that most CRDF is subject to some kind of integrity control.
Concerns remain about integrity controls for private donors and groups that are not members of the OECD’s Development Assistance Committee (DAC). However, these providers contribute only 2.7% of CRDF, therefore reducing the overall CF corruption risk. There is also a lack of transparency around the existence or quality of integrity controls on domestic CF (whether public or private), and private CF generally.
Funds from public and private sources are frequently jointly invested in climate activities in ‘blended finance’ arrangements. Examples include: the Santa Rita hydroelectric dam in Guatemala (discussed below); and the Lake Turkana Wind Power project in Kenya, which received investment capital from Danish and Finnish government-owned development funds and Denmark’s private wind energy firm, Vestas Wind Systems.cac077b07131 Because public and private sources of CF are not invested in isolation, another concern – as blended finance arrangements become more common – is the risk of possible ‘contamination’ as corrupt practices prevalent in one source of funding spill over into the other. See Table 6 for a breakdown of global CF by public and private sources.
Table 6: Sources of climate finance, 2021–2022
|
Source |
Value (millions) |
% (of subtotal) |
% (of total) |
||
|
PUBLIC SOURCES |
|||||
|
National Development Finance Institutions (DFIs) |
238.4 |
37.3 |
18.9 |
||
|
State-owned enterprises |
110.3 |
17.2 |
8.7 |
||
|
Governments |
99.6 |
15.6 |
7.9 |
||
|
Multilateral DFIs* |
93.1 |
14.6 |
7.4 |
||
|
State-owned financial institutions |
60.9 |
9.5 |
4.8 |
||
|
Bilateral DFIs* |
32.6 |
5.1 |
2.6 |
||
|
Multilateral climate funds* |
2.9 |
0.5 |
0.2 |
||
|
Export credit agencies |
1.8 |
0.3 |
0.1 |
||
|
Public funds |
0.2 |
0.0 |
0.0 |
||
|
Subtotal |
639.8 |
100.0 |
50.6 |
||
|
PRIVATE SOURCES |
|||||
|
Commercial financial institutions |
235.0 |
37.6 |
18.6 |
||
|
Corporations |
192.2 |
30.8 |
15.2 |
||
|
Households/individuals |
184.5 |
29.6 |
14.6 |
||
|
Institutional investors |
6.3 |
1.0 |
0.5 |
||
|
Funds |
6.2 |
1.0 |
0.5 |
||
|
Subtotal |
624.2 |
100.0 |
49.4 |
||
|
TOTAL |
1,264.0 |
||||
* These three lines correspond most closely to CRDF as reported by the OECD’s DAC.
Source: Buchner et al. 2023.
Public sources corresponding to CRDF providers – such as the multilateral DFIs, bilateral DFIs, and multilateral climate funds shown in Table 6, which account for a combined total of 10.2% of global CF – will most likely have integrity controls. Similarly, private sources such as commercial financial institutions (eg, banks) and corporations (which together account for 33.8% of all CF), are likely to have some integrity controls in place – particularly where these entities operate in countries with strong financial regulatory frameworks, such as in North America, Western Europe and some Asian jurisdictions, or if they are listed on a reputable stock exchange. This means that perhaps 44% of all CF is subject to some sort of sound regulation that targets corruption.
Despite the probable existence of corruption controls for public sources of CF in certain countries, these same countries can suffer from secrecy around private sources of CF. Also, even if a country is relatively non-secretive, it may be a destination for offshore wealth, making it a significant ‘supplier of secrecy’ to private institutions and individuals. For example, the following jurisdictions feature in the bottom ten of the Tax Justice Network’s Financial Secrecy Index (FSI) largely because they are significant ‘suppliers of secrecy’: USA (lowest ranked at no. 141), Japan (no. 136), Germany (no. 135), China (no. 133), Netherlands (no. 132), and UK (no. 131).0b58ec3d6d7b And while USA, Japan, China, and Netherlands have relatively moderate scores for how much financial secrecy their laws allow, when coupled with the fact they are significant destinations for very large amounts of offshore wealth, they score very low on the overall index rankings. The laws of UK and Germany score well because they are not very secretive. However, because both countries are the destination for so much offshore wealth, they rank low on the FSI.
Financial secrecy is an established risk for anti-money laundering controls. It is also relevant to integrity and action in CF because financial secrecy helps to obscure the origin and destination of private sources of CF. Governance transparency is important for public sources of CF, and so financial secrecy hinders a just transition. Several red flags for integrity become evident from Table 6 when risks for integrity around private CF are considered:
- China is the destination for at least 38.3% of all CF (51% of all domestic CF). Chinese institutions and corporations (public and private) are significant for climate action but are not as regulated or transparent as institutions and corporations in OECD member states.
- The category Households/individuals, which accounts for 14.6% of private CF, includes ‘high-net-worth individuals and their intermediaries’ (eg, family offices investing on their behalf). An entire industry of financial service providers, offshore financial centres, and investment vehicles (such as Trusts) exist to facilitate secrecy for wealthy private investors.
- Private sources in the categories of Institutional investors and Funds account for only 1% of CF. However, as these are important for mobilising billions in the additional private capital required to manage global warming, they are likely to expand exponentially. Transparency around the beneficiaries of funds, and secrecy around offshore investments varies depending on jurisdictional laws. This means that who ultimately benefits (or loses) from CF investments may remain unknown.
- Controls around undue influence, such as fossil fuel producers’ access to decision makers who develop climate policy, are poorly understood or weak for countries such as China – but also for Russia, India and Turkey all of which are significant for CF (regionally, if not globally). Large OECD economies that are major sources and destinations of CF have some controls in place. However, undue influence in these countries is a major concern within the climate domain, because they are some of the biggest emitters of GHG, and home to some of the largest fossil fuel producers.fdc7fb9fcb8d
Climate-related development finance according to gender equity
The OECD’s CRDF data is categorised by whether gender equity is a ‘principal’ or ‘significant’ goal, as shown in Figure 3.
Figure 3: Significance of gender-related CRDF (percentage of total CRDF) 2021
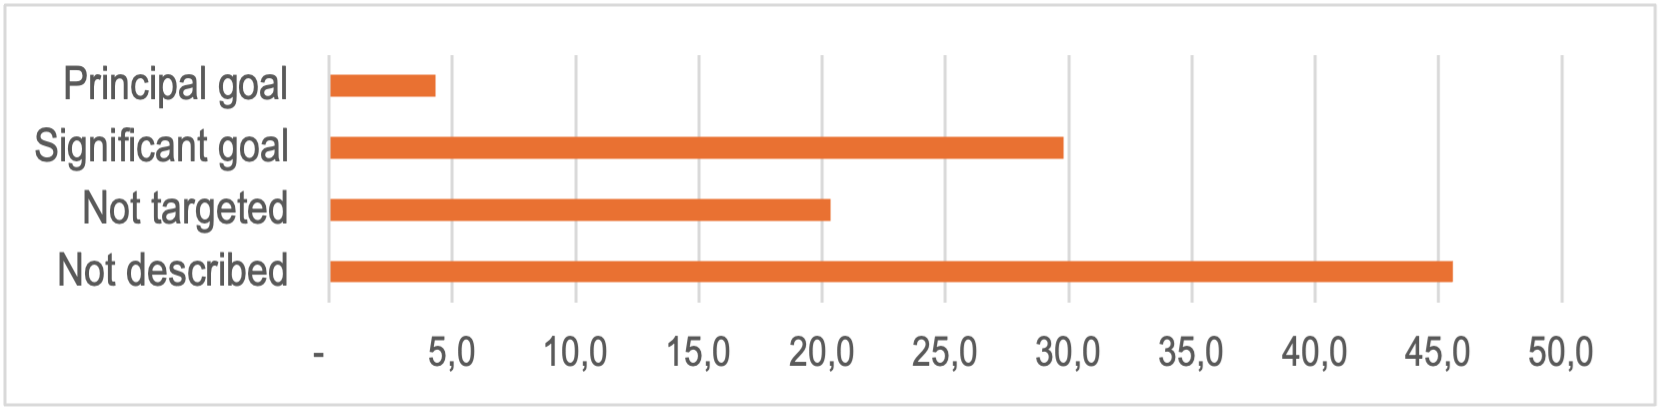
Source: OECD 2021.
To achieve a just transition, climate-related activities need to include and address gender inequality. Figure 3 shows that only 34.1% of CRDF (US$33.2 billion) has gender equity as a ‘principal’ or ‘significant’ goal. This seems low, although this may be more an issue of accurate data classification.
Figure 3 also highlights a gap in the data: 45.6% of CRDF gender-related goals (US$44.4 billion) are not described. Also, for 20.3% of CRDF (US$19.8 billion), gender-related goals are not targeted. In the absence of more information, it is difficult to draw any conclusions about this, because not all climate-related development activities will necessarily make gender equity an explicit goal.
Table 7 shows the top ten recipients of all CRDF that is explicitly focused on gender. Table 8 shows the same type of data, but only for the top ten LDC recipients of CRDF.
Table 7: Top ten countries where gender equity is a ‘principal’ or ‘significant’ goal of CRDF, 2021*
|
All recipients |
CRDF, millions. ‘Gender equity’ is a ‘principal’ or ‘significant’ goal |
% of recipient’s total CRDF |
Vulnerability to climate change, 2021 (0=not vulnerable; 1=very vulnerable) |
|
1. India |
3,993 |
50.3 |
0.498 |
|
2. Bangladesh |
2,329 |
70.0 |
0.531 |
|
3. Turkey |
1,287 |
36.7 |
0.353 |
|
4. Indonesia |
1,041 |
41.5 |
0.440 |
|
5. Mexico |
1,022 |
63.6 |
0.385 |
|
6. Pakistan |
722 |
31.4 |
0.521 |
|
7. Egypt |
542 |
20.0 |
0.420 |
|
8. Uzbekistan |
527 |
43.3 |
0.364 |
|
9. China |
522 |
24.7 |
0.387 |
|
10. Costa Rica |
476 |
69.0 |
0.372 |
|
Total |
12,461 |
37.5 |
|
* Of CRDF with gender equity as a principal or significant goal, 26% (US$8.6 billion) is directed to regional programmes, but these are not included in this list. If they were included, ‘Developing Countries, unspecified’ would be no. 2 (US$3.4 billion), ‘Africa, regional’ would be no. 3 (US$2.5 billion), and ‘South of Sahara, regional’ would be no. 9 (US$0.6 billion).
Sources: OECD 2021; Chen et al. 2023.
Table 7 shows that the countries receiving the most gender-targeted CRDF are not the most vulnerable to climate change (defined here as having an ND-GAIN vulnerability to climate change score of 0.520 or more, which would place them in the bottom quintile). Only Bangladesh and Pakistan are in the ‘most vulnerable’ category.
Table 8: Top ten least-developed country (LDC) recipients where gender is a ‘principal’ or ‘significant’ goal for CRDF, 2021
|
LDC recipients |
CRDF, millions. ‘Gender equity’ is a ‘principal’ or ‘significant’ goal |
% of recipient’s total CRDF |
Vulnerability to climate change, 2021 (0=not vulnerable; 1=very vulnerable) |
|
1. Bangladesh |
2,329 |
70.0 |
0.531 |
|
2. Mali |
435 |
66.8 |
0.596 |
|
3. Ethiopia |
389 |
34.0 |
0.547 |
|
4. Burkina Faso |
370 |
44.0 |
0.537 |
|
5. Tanzania |
302 |
27.8 |
0.504 |
|
6. Senegal |
276 |
32.5 |
0.520 |
|
7. Rwanda |
271 |
53.0 |
0.527 |
|
8. Niger |
266 |
21.8 |
0.632 |
|
9. DRC |
246 |
23.3 |
0.564 |
|
10. Nepal |
218 |
72.7 |
0.490 |
|
Total |
5,102 |
15.4 |
|
Sources: OECD 2021; Chen et al. 2023.
A comparison of Tables 7 and 8, shows that CRDF allocated to upper- and lower-middle-income countries is more focused on gender equity outcomes than CRDF allocated to LDCs (with some exceptions such as Bangladesh, Mali and Nepal). So, while LDCs are more vulnerable as a group to climate change, and the climate crisis generally affects women more than men, this has not translated into more gender-targeted activities for LDCs.
2. Case studies of climate finance corruption
It can be difficult to establish precisely how corruption causes climate action to fail. Sound evidence of corruption is often difficult to obtain: providers of CF may lack transparency about corrupted projects; and limited transparency around legal findings and processes can make it difficult to fully understand the charges, evidence, types of convictions, and penalties given. Case studies of corrupted climate initiatives are a useful source of information. They can demonstrate how climate action is undermined, and highlight lessons for CF-funded action, including what has worked to successfully respond to corrupted projects. Good case studies of corrupted CF, supported by solid evidence are frequently older because it takes time for information to become public, especially if judicial processes are the major source of information (the justice system can be very slow).
The following three cases studies involve different types of CF:
- Hydroelectric dam in Guatemala funded by blended finance (a mitigation project)
- Flood prevention project in South Korea funded from public sources (an adaptation project)
- Solar-powered generator in USA funded from private sources, but which permitted tax write-offs (a mitigation programme).
The planning and implementation of these activities contained some classic corruption risks and integrity gaps, as summarised by Table 9.
Table 9: Corruption risks and lessons learned from three illustrative cases
|
Illustrative case |
Key corruption risks |
Lessons learned |
|
1. Guatemala Santa Rita hydroelectric dam |
|
|
|
2. South Korea Four Major Rivers Restoration Project |
|
|
|
3. US solar-powered mobile generators project |
|
|
Case 1: Human rights abuses in hydroelectric dam project (Guatemala)
In 2010, the Guatemalan government authorised the construction of a 23-megawatt hydroelectric dam called the Santa Rita Project. Investment capital came from the private Latin Renewables Infrastructure Fund (LRIF), which was backed by the German development finance institution, the Netherlands Development Finance Company, the International Finance Corporation (IFC), the Spanish Agency for International Cooperation, and the Swiss Investment Fund for Emerging Markets. The project required flooding that would displace Indigenous Mayans, a community that has suffered centuries of abuse and marginalisation.
Three risk factors were not addressed:
- Investors did not complete adequate due diligence.
- The process for obtaining FPIC was flawed. The contractor arranged community consultations and social programmes, but communities’ participation was allegedly conditional on acceptance of the dam – participants were selected to allow the contractor to misrepresent community views. Despite complaints, the fact that the dam would deprive the community of land, water, food, and transport, and that FPIC had not been given, construction proceeded.
- Social risk factors were poorly managed.
In 2013, protestors occupied a site and damaged equipment. This was misrepresented by the contractor as protestors being upset because they didn’t want to be arrested; the protestors were actually distressed because their grievances were being ignored. The contractor and Guatemalan authorities responded with violence. Police were sent to quell the protests and to evict residents for construction work. It is reported that some fired tear gas and others stole from villagers’ homes. Seven people were killed in the ensuing violence, including state officials. In 2014, the UNFCCC registered the project with its Clean Development Mechanism (CDM), despite pleas from local communities not to do so.
Mayan organisations, international CSOs, members of the European Parliament, and the United Nations High Commissioner for Refugees (UNHCR), criticised the project and campaigned to revoke its CDM registration. The IFC Ombudsman’s compliance appraisal found that the IFC had given inadequate attention to environmental and social risks and other contextual factors associated with the project. Also, the corporation did not ensure that the staff authorising the project were adhering to their own standards. In 2017, following the IFC Ombudsman’s review, funders withdrew their support, and the project was cancelled.4dfafc698cbf
Corruption risks and lessons learned
The Santa Rita project had multiple failings. Affected communities were not adequately consulted and did not want the project. However, when they complained, they faced violence and harm. There was no process resembling a just transition. The IFC Ombudsman found that the LRIF lacked experience in managing environment and social risk, and appeared ignorant of why it was important to address these risks. The LRIF and the public institutions involved committed investment capital without adequate due diligence on the ESG risks or on each other.
The primary climate action failure was that zero renewable energy was generated (because the project was cancelled). The key lessons are:
- Ignoring community complaints can result in personal harm and project failure.
- Private investors need a better understanding of environmental and social risks, including: (a) how to manage them; and (b) how unmanaged risks can jeopardise their investments. Public development institutions, some of which have a sophisticated understanding of such risks, could transfer their knowledge about such risk management.
- Public development institutions need to be more wary of private investors, and complete due diligence processes before providing them with public equity.
Case 2: Collusion in flood adaptation infrastructure project (South Korea)
The Four Major Rivers Restoration Project (FMRRP) was a river diversion and restoration project – designed to improve flood control infrastructure – implemented between 2009 and 2012. The project focused on four major river systems and 14 tributaries extending over 1,266km in South Korea. The project, valued at US$20 billion, was fully funded by the South Korean government and K-Water Co (a state-owned enterprise responsible for developing and managing water resources).80021303c966 It was designed to secure water resources by improving flood control, which was becoming more frequent and serious as a result of elevated rainfall linked to climate change. Other objectives were to restore ecosystems, improve water quality, and stimulate local economies.
The project contained multiple, poorly managed, risk factors for corruption:
- It was a ‘pet project’ of then President Lee Myung-bak, and the centrepiece of his ‘Green New Deal’ aimed at combining green growth and job creation after the 2008 global recession.5cbed4961e87 President Lee made it clear that he wanted the project finished before his term ended, a deadline that created pressures for rapid tendering and construction.
- From an integrity perspective, the tender process was flawed. It involved 15 contracts (for dams and other works) that were advertised simultaneously, and were to be awarded to the lowest cost bidder (rather than the best quality, or a mix of quality and cost). Bidders were required to submit designs as part of their bid. The costs for these designs would not be compensated. Engineering project designs are expensive, so a company that lost a bid would lose its design investment costs, which could be millions of dollars for large projects such as the FMRRP.98097d78b1c6
- Because the lowest bidder would win the contract, and other bidders would lose their design costs, this motivated companies to collude. The 18 bidding companies agreed who would ‘win’ each of the 15 contracts by agreeing who would submit the lowest bid (some companies arranged consortiums for the project, enabling all 18 to benefit).
- Once the companies agreed to collude and had ‘won’ their tenders, they lacked incentives to deliver quality projects. The initial designs were the lowest cost possible, resulting in substandard construction.
- Because government officials were pressured to ensure that the project finished before the end of President Lee’s term, they did not properly manage the project, which meant that substandard infrastructure was not detected.
Corruption risks and lessons learned
The FMRRP achieved some objectives, including: reducing flooding in some areas; minimising water scarcity; improving water quality; and some revitalisation of local economies. However, an enquiry into the FMRRP by a new government, found that six of 16 dam walls had cracks and leaks, and there was erosion in reservoir levees, all of which required expensive remediation. The substandard infrastructure worsened the quality of water used for human consumption and agriculture in some areas.ea2d4a9c412e Presidential pressure to complete the project curbed public debate and, presumably, made contractors comfortable with ignoring criticism. While some academics, NGOs, journalists, and farmers living next to the rivers were willing to talk about how the project had negatively affected communities, others were afraid that speaking out could be dangerous for them and jeopardise future government funding for their communities.66e34220a685
The 18 companies were fined a total of US$100 million and were banned for a period from bidding for government contracts. The reputational damage caused challenges in winning new foreign contracts. For example, Hyundai Engineering & Construction submitted a bid for a US$14 billion oil refinery project in Kuwait, but received a letter from the project administrator asking it to explain the penalties it received for its role in FMRRP corruption. Another Korean contractor in the process of building a power plant in the United Arab Emirates, was also asked to explain its role in FMRRP corruption. A spokesman for the International Contractors Association of Korea, told the media: ‘…foreign companies considering giving orders to Korean companies are trying to verify issues related to the four rivers project.’ He went on to say: ‘The scariest thing for Korean companies is that they might lose the credibility they have developed with foreign clients.’2d10b8cf6f67
The climate action failure was that adaptation infrastructure (such as dam walls and levees) was substandard and water quality worsened in some areas. The key lessons are
- Tender processes designed without integrity risks in mind are likely to facilitate corrupt behaviour by unscrupulous tenderers and result in flawed infrastructure.
- When mechanisms to engage stakeholders are inadequate, project design and monitoring can facilitate suboptimal construction.
- The burgeoning market for CF-funded contracts will attract private actors, but the reputational damage if those firms engage in corruption has implications beyond the climate domain.
Case 3: A billion-dollar solar power fraud (USA)
In California in 2007, Jeff Carpoff, an entrepreneur and former drug dealer, had an epiphany: a mobile generator that produced energy from solar panels could be a green alternative to diesel generators. He rigged solar panels to a generator mounted on a trailer that could be towed by a car, and found that the invention worked. Carpoff started a firm, DC Solar, to sell these mobile solar-powered generators. The paint company Sherwin-Williams bought 192 of them for US$29 million, and Carpoff’s invention soon attracted other investors, including Warren Buffet’s Berkshire Hathaway holding company (the world’s sixth largest company).1e3e3dabcda5 The generators were used for such things as concerts and film shoots. Hollywood actor and environmentalist, Leonardo DiCaprio, posted photos on Facebook of his location trailer being powered by them.
Risk factors included:
1. While the generators worked, they were prone to malfunction and were not well made. Their value became linked to a US Treasury scheme that gave commercial investors a 30% credit (a tax write-off) they could claim off the cost of the generators they bought: this was the key corruption risk factor for the project. The US Treasury classified these tax credits as ‘investments in renewable energy’. DC Solar realised that they could sell generators to investors and then lease them to users (investor-owners themselves did not need to use them), allowing investors to claim the tax credit and also receive lease income.
2. A second risk factor was related to investors’ lack of incentives to conduct adequate monitoring. Because most investors did not insist on a visual inspection of their generators, DC Solar realised it did not actually need to manufacture the generators – it needed to provide lease income to investors (or income it claimed to have come from leasing). When a customer insisted on visual inspection of their generators, vehicle identification number stickers were taken from some units and applied to other units for the inspection, and the customer was told they were theirs. Fake leasing contracts were drawn up and given to investors as ‘proof’ of leasing agreements. To ‘dupe buyers who wanted real-time data on their units’ whereabouts, [DC Solar] workers buried GPS transponders in out-of-the-way locations, minus the generators they were billed as being attached to.’490a8897d592
3. Profits from selling generators that never actually existed were distributed to early investors as lease income. Carpoff also returned to drug dealing to generate cash to pay investors who were owed lease income. DC Solar’s ‘business’ effectively became an accounting and lease revenue fraud scheme, using Ponzi-like circular payments.
Corruption risks and lessons learned
Between 2011 and 2018, DC Solar sold more than 17,000 generators, but at least half never existed.010060a5eaa4 Private investors paid approximately US$2.5 billion to DC Solar,0cd0890279de allowing them to claim approximately US$750 million in tax write-offs. This also allowed the US government to claim it had invested this amount in solar energy. In November 2021, Carpoff, who admitted guilt, was sentenced to 30 years in prison and ordered to pay US$790.6 million in restitution for fraud and money laundering offences.fe161e809f12 Co-conspirators were also convicted. Carpoff’s lawyer reminded the sentencing judge that the fraud occurred within the ‘ecosystem’ of private sector finance: ‘The professional advisers who gave the deals the sheen of legitimacy. The brokers who got six-figure commissions for bringing buyers to the table. The buyers themselves, who vetted the transactions with teams of experts yet returned to DC Solar for one multimillion-dollar deal after the next.’7e238f8e6820
The climate action failures included that far less renewable energy was generated than claimed, and the US government unwittingly exaggerated its investments in solar energy. The key lessons are:
- As private capital becomes more prevalent in CF, the climate domain will increasingly be exposed to similar fraudulent, unquestioning, and unethical practices, as exist in the private sector.
- Fraud involving tax write-offs can only exist when private sources of CF are involved (because public sources do not get tax breaks). Tax write-offs and government subsidies are a red flag for integrity risk.
- Investors failed to complete due diligence on Carpoff and DC Solar, neither of which had any background in renewable energy technology or finance. It is imperative that investors undertake due diligence on investment targets.
3. The role of politics in climate finance allocation
New patterns of investment will continue to change the profile of CF. Currently, CF, climate action, and their associated integrity challenges are dynamic. But evolving technology for reducing GHG or for designing new adaptation measures is not the sole cause. Rather, politics is at play, including ‘push’ factors from the Global North and China that result in investments in producers of critical minerals (despite poor corruption control) and ‘pull’ factors originating from the Global South, where some countries have successfully managed to secure a ‘piece of the CF pie’ – even though neither their potential for emissions reduction nor their vulnerability to climate change justify such investments.
CF has become a market where jurisdictions compete with each other for investment, using strategies based on mitigation potential, adaptation needs, and politics. Some countries will obtain CF despite corruption; others will fail to attract CF because of corruption. This section highlights political-economic developments that are currently shaping CF. We identify the underlying forces behind these developments, and suggest how CF is likely to be allocated in the future.
The central role of critical minerals
Production and processing of the minerals that are critical for renewable technologies will need to increase if the UNFCCC’s climate goals are to be met. This includes: copper, lithium, nickel, manganese, cobalt, and graphite for electric vehicle (EV) batteries; copper, manganese, and zinc for wind turbines; and rare earth elements for semiconductor technology used in the energy sector.817208a9cee0
The International Energy Agency estimates that, to reach net zero globally by 2050, we will need six times the amount of critical minerals in 2040 than we use today.76a6deecfbf5 Producing and refining these minerals is concentrated in countries with major weaknesses around either transparency or corruption controls, or both (see Figure 4).
Figure 4: Major producers of selected minerals, 2019 and 2025 (indicative)
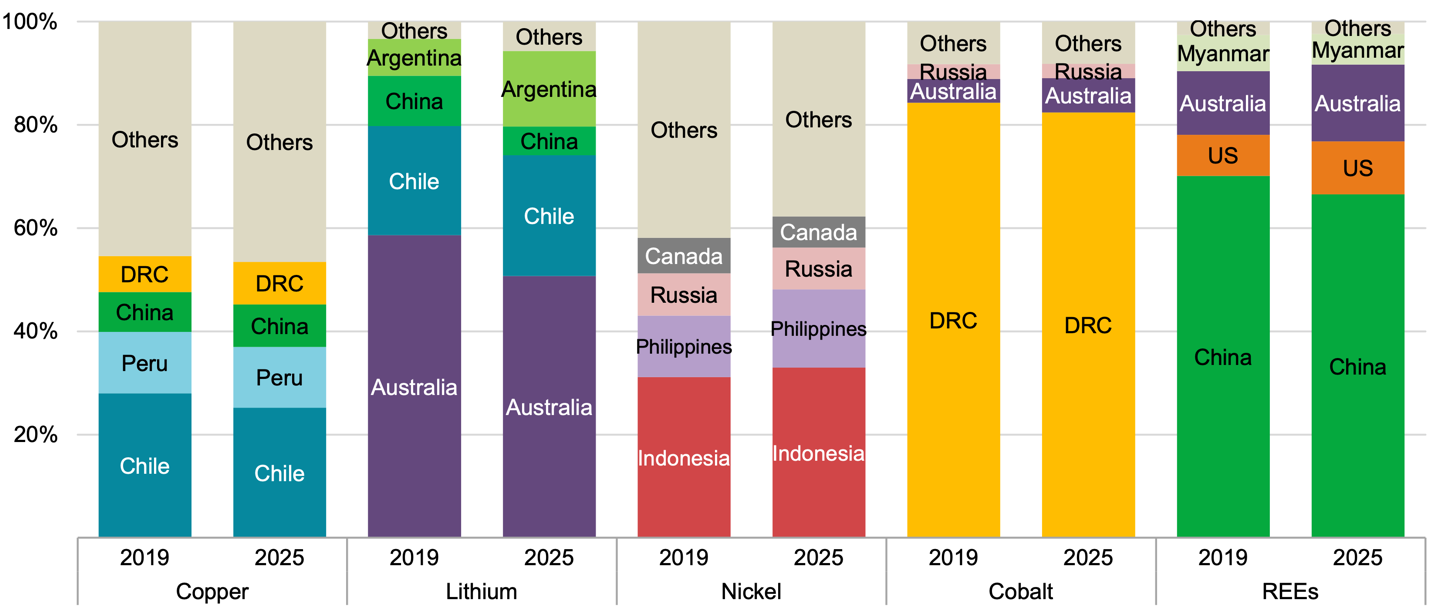
* Rare earth elements (REEs) in Figure 4 include neodymium, praseodymium, terbium, and dysprosium.
Source: International Energy Agency 2022: 121.
One change not shown in Figure 4 relates to nickel and cobalt: in the early 2020s, Chinese processors adopted new technology that more efficiently extracts nickel from less concentrated deposits. This technology saw Indonesia’s share of global nickel production increase 54% from 2021 to 2022, and total global nickel production increase 21% over this period.6452002146bf Cobalt is a by-product of this type of nickel production, so the technology also caused Indonesia’s cobalt production to increase 77% from 2022 to 2023. Global cobalt production increased 17% over this period.02043a4572cd Therefore, Indonesia is now even more important for nickel and cobalt than shown in Figure 4.
Indonesia refined approximately 50% of world nickel in 2023. However, China is the largest processor of most minerals shown in Figure 4, including 80% of the world’s lithium, 70% of cobalt, 40% of copper, 35% of nickel, and as much as 90% of some rare earth elements.1093372fb7f3 While its own renewable energy sector (the world’s largest) absorbs much of its refined production, other countries also rely on China’s output of processed critical minerals.
Motivated by economic and security concerns, the USA, Japan and EU have adopted programmes aimed at restructuring supply chains to bypass China and Chinese-owned enterprises.bdfd479e5473 These policies are likely to result in even greater investments in many of the same producer countries shown in Figure 4, with the exception of Russia. Poor relations between Russia (a significant nickel and cobalt producer) and the West, make bypassing it another objective of the West’s attempts to realign supply chains.
Despite the West’s desire to restructure supply chains, production of critical minerals will remain concentrated in current sources in the near future due to: (a) the locations of known deposits being in existing producer countries; and (b) the lengthy period required to bring new deposits to commercial production. This concentration of production, along with strategically motivated investments by the USA, EU and Japan, signals that integrity challenges around the energy transition are set to intensify and increase in scope.
A recalibration of supply chains away from China is likely to increase CRDF, and CF more generally, to those producers shown in Figure 4: Argentina, Chile, Peru, Indonesia, the Philippines, and DRC – as well as to Australia and Canada.6878d83f18d2
Graphite and platinum are also critical to the energy transition, and producers of these minerals are also likely to received increased CF investments.957068b4f479 Investments in processors in the USA, Japan and EU, would also mean increased CF (especially from private sources) to these jurisdictions. China is the largest producer of graphite, with Mozambique and Brazil second and third. For platinum, South Africa is the largest producer, with Russia second and Zimbabwe third.
Integrity risks that jeopardise a just transition
The increased significance of critical minerals introduces wider risks, even if mining activities do not rely on CF. And, because risks in mining affect climate concerns, mining also has the potential to threaten a just transition, where benefits (employment in safe conditions, and access to energy) are shared and those communities with the least resources are protected from negative impacts. For example:
- Forced resettlement (sometimes into host communities with which the relocated community has historic grievances with)
- Violence (including sexual violence) by project partners
- Loss of jobs and destruction of livelihoods, without provision of alternatives that do not leave communities poorer or with worse working conditions.
When a community becomes worse off due to a climate-related investment, it is frequently the most marginalised members who suffer the worst effects, including:
- Women (who sometimes resort to sex work due to lack of alternatives)
- People with disabilities (whose support networks and livelihoods may be destroyed due to relocation)
- Ethnic minorities (who may miss out on compensation, especially if they lack legal title to land being appropriated for new infrastructure)
- Indigenous and forest communities
- Poor landowners and land users.
One critical mineral that illustrates production and trade lacking in meaningful integrity controls is cobalt. Author and academic, Siddharth Kara,13533508294a details how artisanal cobalt production in DRC – most of which is sold to Chinese processing firms for EV batteries – includes: systemic child labour; extremely bad working conditions; gendered divisions of labour where women are relegated to the lowest paid tasks; covered-up or falsified causes of worker deaths; exposure to toxic substances; threats or use of violence to control miners and to suppress labour protests; collusion by buyers to maintain exploitative ore purchase prices; compulsory acquisition of land for mining without adequate compensation; and corrupt practices on the part of state officials, producers and buyers to enable illegal exploitation and to generate false reports about production, labour, safety, and community consent.
As Kara explains, governance in DRC has been profoundly influenced by institutions, laws and practices (including corruption) established by elites over 140 years to enable them to exploit natural resources in the face of community opposition. More than 7 million people live in cobalt-producing areas in southern DR Congo. There is an absence of anything resembling a ‘just transition’ for these communities.
The jurisdictions in the main mineral-producing countries (Figure 4) have a mixed record for integrity. This raises questions about their ability to apply good governance in their mining sectors, or implement policies conducive to a just transition:
- DRC performs poorly on all governance indices.
- Argentina, Chile, Peru, Brazil, Indonesia, the Philippines, and South Africa do relatively well on transparency but, except for Chile, do poorly on control of corruption.
- Australia, Canada, USA, Japan, and EU countries do well on control of corruption, but Australia, Japan and Netherlands score only moderately for transparency – lower than Argentina, Chile, Peru, Brazil, Indonesia, the Philippines, and South Africa.
Of those countries, the following are members of the Extractive Industries Transparency Initiative and therefore subject to its transparency standards around the extractive industry supply chain: Argentina, DRC, Indonesia, Mozambique, Netherlands, and the Philippines (all of which have made moderate or meaningful progress against standards), as well as Peru (currently suspended due to lack of progress). The following countries are not members of the initiative and so are not subject to its standards: Australia, Canada, Chile, China, Brazil, Japan, Russia, South Africa, USA, and Zimbabwe.3a955582a5cb
There are destinations where CF may increase due to strategic realignment of global supply chains for critical minerals. More significant are those countries that may miss out on new investments, or have CF diverted from them. Most of the top ten LDC recipients of CRDF will not receive strategically motivated CF investment. Exceptions will be DRC, and possibly Mozambique (the third largest producer of graphite), despite their weak integrity controls.
Policy contestation by the Global South
Distribution of CF is also being shaped by greater policy assertiveness by the Global South. A recent example is the Loss and Damage Finance Facility (LDFF), established at COP27 in 2022 and operationalised at COP28 in 2023. Developing countries had demanded such a fund since it was suggested by Vanuatu when the UNFCCC was signed in 1992. There are 25 LDFF board members: four are small-island states (Barbados, Fiji, Antigua, and Barbuda) and Timor-Leste is also a board member – a sign of this group’s influence and political acumen.
The purpose of the LDFF is to help the poorest developing countries – those that have contributed least to the climate crisis, and already affected by loss or damage from climate change. For example, communities that have had to relocate due to desertification, or rising sea levels affecting coastal lands, or reductions in freshwater due to melting glaciers. The LDFF will provide grants to rebuild physical and social infrastructure. These are not loans, and not funds already designated for mitigation or adaptation purposes. In contrast to adaptation funding, the LDFF is to address damage already incurred, rather than investments to enable future adaptation to meet climate targets.f2b4c5b28fbf
Initially, the EU, USA and other rich countries refused to support such a fund, arguing that adaptation funding mechanisms should suffice. At COP28 a compromise was agreed: the most vulnerable and damaged countries will be prioritised for compensation for loss and damage; developing countries with large economies (such as China and India) will not be recipients; and funds will come from the Global North, and potentially other wealthy large GHG emitters such as China, Saudi Arabia and United Arab Emirates.2f5ea74cda38
Controls will be needed for the LDFF, as for all other CF. And countries continue to contest whether the LDFF will be managed by the World Bank (the preference of rich countries that have significant control over its operations) or located elsewhere (the preference of developing countries who want to reduce donor control). Developing countries also point out that the World Bank has high administrative overheads (reducing total available LDFF), whereas donors emphasise the World Bank’s financial and integrity controls compared to an unknown alternate host.b4ee169b30e6 If a completely new host governs the LDFF, this would be an opportunity to establish best practice systems from the start. However, whichever states champion such systems may be required to ensure that they are effectively implemented.
Another policy initiative shaped by the Global South is the Just Energy Transition Partnerships (JETPs), a CF delivery platform designed to support coal-dependent, developing, economies to make a just transition. Countries that have signed JEPTs include India, Indonesia, Kazakhstan, Pakistan, the Philippines, Senegal, South Africa, and Vietnam. Funding is largely in the form of loans (bringing profits to the lender), and has been provided to date by France, Germany, UK, USA, EU, MDBs, national development banks, and development finance agencies, as well as private sources.b9de384e3e95
Table 10: Selected indicators of eight JETPs recipients
|
Jurisdiction |
GHG, 2021 (% of total) |
Vulnerability, 2021 (0=not vulnerable, 1=very vulnerable) |
COC, 2022 (-2.5=highly corrupt, 2.5=very clean) |
T-Index, 2021 (0=not trans., 100=very trans.) |
CPI score, 2023 (0=highly corrupt, 100=very clean) |
|
1. India |
6.9% |
0.498 |
-0.32 |
60 |
39 |
|
2. Indonesia |
3.0% |
0.440 |
-0.43 |
78 |
34 |
|
3. South Africa |
1.0% |
0.389 |
-0.32 |
75 |
41 |
|
4. Pakistan |
1.0% |
0.521 |
-0.80 |
70 |
29 |
|
5. Vietnam |
0.9% |
0.475 |
-0.29 |
58 |
41 |
|
6. Kazakhstan |
0.6% |
0.322 |
-0.19 |
58 |
39 |
|
7. Philippines |
0.5% |
0.463 |
-0.54 |
70 |
34 |
|
8. Senegal |
0.1% |
0.519 |
-0.03 |
58 |
43 |
Sources: Climate Watch 2024 for % of global GHG; Chen et al. 2023 for vulnerability to climate change; Control of Corruption (COC) Index: World Bank 2023a; T-Index: Mungiu-Pippidi 2023; and Corruption Perceptions Index (CPI): Transparency International 2023.
JETPs embrace a for-profit model of energy generation, but one that will hasten the replacement of coal-fired power stations with renewable energy. The first JETPs project was initiated for South Africa at COP26 in 2022 and is already underway, along with several others, signalling that JETPs are less contested than the LDFF.230c9622b254 Even though JETPs satisfy rich governments’ desire for market-led solutions involving private capital and avoiding grants, they are also a policy success for developing countries.
However, as shown by Table 10, with the exception of India and Indonesia, countries that have signed JETPs are not major GHG emitters. These countries would be unlikely to benefit from most CF given that 91% of funding is currently concentrated on mitigation activities.f06f894aadd4 Also, only two countries (Pakistan and Senegal) are significantly vulnerable to climate change, being in the bottom quintile of the ND-GAIN index. While four do reasonably well for transparency (Indonesia, South Africa, Pakistan, and the Philippines), all do poorly for control of corruption. Despite these factors, JETPs enable these countries to receive a larger piece of the ‘CF pie’. This allows them to grow their emerging economies, establish a domestic renewable energy sector that creates jobs, and obtain the investment capital needed.
4. What we have learned from the distribution of climate finance
Corruption risks in climate finance distribution
The current distribution of CF highlights some known corruption risks – as shown in the case studies in Section 2, and other data:3a9126265bbf
- Large amounts of money
- Unclear and evolving rules
- Complex institutions and disbursement mechanisms
- Inadequate monitoring
- Highly technical science that is not well understood by policymakers
- A large majority of funding directed to sectors with significant corruption risks – such as construction, energy, and forestry
- Multiple actors with varying anti-corruption controls
- The climate crisis creates an urgent spending imperative that can detract from illegal behaviour.a22de956867b
Some of these risks are now better managed, for example:
- Standards and regulations have been introduced.
- CF expenditure and implementation of climate activities are monitored externally by an increasing number of CSOs, and public CF is subject to internal monitoring by multilateral financial institutions and governments.
- Risks in key sectors (such as construction, energy and forestry) have been repeatedly flagged, partly through publicity about corruption in climate action.f4496ae2a382
- Science around GHG emissions and climate targets is better explained and understood.
Other risks for corruption are increasing in scope and/or remain inadequately managed. For example, the volume of CF is larger than ever before and will grow exponentially if emissions targets are to be met, and the spending imperative is likely to only heighten. The burgeoning participation of private actors is also creating institutional and disbursement complexity, and attracting stakeholders to CF that have varying anti-corruption controls. Despite previously signing up to global standards around managing environmental and social risks related to extractive projects, some private stakeholders have now backed away from those standards – for example, in March 2024, four major American banks left the Equator Principles that help assess environmental and social risk.c21cbd0e7f42 Lack of adherence to such standards will create inconsistency in risk management. Also, because there are fewer participants, these mechanisms will be less effective as peer-learning tools.
The case studies from Guatemala, South Korea and USA in Section 2 indicate additional specific integrity risks that are also relevant to the climate domain:
- Project design processes that pay insufficient attention to the concerns of affected stakeholders
- Tender processes that facilitate corrupt behaviour
- Inadequate due diligence on private sector partners
- Political pressures, aside from spending imperatives related to climate goals, that are likely to cause inadequate monitoring and community consultation5704c9c89bfc
- The critical role for civil society and community stakeholders in monitoring climate initiatives for integrity breaches.
The benefits of a global public good, such as reducing GHG emissions, are independent of a project’s location.8384466f1262 This is because, ‘No matter where a ton of CO2 is reduced, a vulnerable country [eg, such as Bangladesh] will benefit from these emission reductions in exactly the same way’.f5ae7917522d From this perspective, the current distribution of much CF to the Global North and China is encouraging, because they generate 46.9% of all GHG emissions—see Table 11.
Table 11: Top 11 GHG emitters and their percentage of global emissions
|
Jurisdiction |
% |
|
1. China |
25.8% |
|
2. USA |
11.2% |
|
3. India |
6.9% |
|
4. EU (27) |
6.3% |
|
5. Russia |
4.0% |
|
6. Brazil |
3.1% |
|
7. Indonesia |
3.0% |
|
8. Japan |
2.2% |
|
9. Iran |
1.9% |
|
10. Canada |
1.5% |
Source: Climate Watch 2024.
However, the location of mitigation initiatives matters greatly: CF invested in less corrupt countries is likely to deliver more benefits than CF invested in more corrupt countries. CF that comes with strong integrity controls can better ensure that GHG mitigation programmes deliver intended outcomes. Broader controls that reduce corruption can also shift countries into an integrity category where climate-related activities are more likely to achieve intended outcomes.
But, with the exception of the USA, EU, and Canada, much CF is not invested in countries that are major polluters and have strong corruption controls. While Brazil and Indonesia have relatively good transparency, it is weak in China and Japan. India, Russia, Indonesia, Brazil, and Iran all do poorly for control of corruption, yet these five countries account collectively for 18.5% of all GHG emissions.
Gaps in our knowledge of the links between climate finance and integrity risks
Global CF and CRDF data highlight areas of risk that, when poorly managed, can jeopardise climate action. Less clear are the precise causal relationships between integrity and project failure. Knowledge from case studies is helpful, but does not account for an entire country’s vulnerability to climate change, or the strength of its integrity systems. However, they show how poorly managed risks can negatively affect the energy transition at project level.
- The Guatemalan Santa Rita Project shows how poorly managed social risks caused a project to fail. It also harmed a community and slowed the energy transition by hindering mitigation through wasted CF.
- The South Korean FMRRP included poorly managed procurement risks. It also failed to properly engage stakeholders who could have detected and reported problems (by playing a monitoring role). This resulted in substandard adaptation infrastructure, which reduced the benefits of the CF invested.
- The USA mobile solar generator scam highlights poorly managed risks around due diligence and investment monitoring. The planned mitigation outcomes – reduced GHG emissions through replacement of diesel generators – were not achieved; and 30% of the investment capital deemed ‘climate finance’ was wasted in terms of climate action.
Emergent challenges in managing integrity risks in climate finance
Data from Buchner et al.,c7619d34ae94 the three case studies (Section 2), and new political-economic developments in the climate domain, highlight emergent knowledge gaps, which bring their own challenges to successful CF application. Further research is needed to fully understand the integrity risks involved, and the controls that could be used to manage them. Private investment is a key theme across multiple knowledge gaps:
- In some areas, the private sector has more advanced integrity risk management controls than the public sector – for example, in anti-money laundering, due diligence, and monitoring the veracity of corporate performance. However, application of these controls is highly inconsistent across enterprises, appearing to depend more on firm size, cost and regulatory pressure rather than on fundamental integrity objectives. Understanding how to improve consistency of integrity across private CF will be a key challenge in the climate domain.
- Although there are inventory-like assessments of integrity controls for some public sources of CF,ec2ea767403a there is no compilation that allows for a comparison of private and public sector integrity controls relevant to CF investments. Ideally, this would include where standards and practices overlap, or where controls could be applied universally. Analysis of this information would help to understand strengths, weaknesses and areas for potential coordination.
- The solar generator case in the USA highlights the complexity in reporting and accounting associated with tax write-offs and government subsidies. Subsidies are a particular area of risk given they are set to increase following the recent adoption of domestic climate-related policy initiatives in the USA (Inflation Reduction Act, 2022), EU (the European Green Deal, 2019), and Japan (Green Growth Strategy, 2020).1936b667782e How the complexity around tax write-offs and subsidies can be manipulated is likely to become prominent issue in CF.
All sources of CF have integrity risks relating to the location of new renewable energy infrastructure, such as windfarms, hydroelectric dams, or solar panel or tidal energy installations. Many of these will be sites where communities already live and derive livelihoods. Gargule (2019) researched the marginalisation of pastoral communities affected by the Lake Turkana windfarm in northern Kenya. His article argues that the location of renewable energy infrastructure is deliberately depoliticised by governments, private actors, and development organisations to facilitate investment and downplay grievances.
Some integrity risks associated with locating infrastructure where people already live are well known, including cases relevant to the climate domain. For example: suboptimal location of windfarms in Italy caused by corruption of local government decision makers (the issue was bribery);f5a6df68c388 or location of projects unwanted by affected communities, such as the Guatemala Santa Rita hydroelectric project (there was no consent and no other foundations for the project to support a just transition).
Emergent knowledge gaps regarding the location of new renewable infrastructure, relate to the ability of project and programme planners to:
- Identify contextual factors that can cause renewable energy infrastructure to be located in certain locations. For example, high-level political pressure, local officials’ self-interest, marginalised community stakeholders perceived as being easy to suppress, or interest from organised crime groups.
- Understand technical claims about why infrastructure should be in a certain location when other sites may available or more suitable. Parties with vested interests (profit motives) in a certain location may ‘fake the science’ to get the outcome they want. Independent assessors, if available, could be used as part of an integrity review.
- Manage integrity risks associated with pressures to locate infrastructure in a certain location, including for initiatives funded by either public or private capital.
Integrity risks around a project’s location are equally pertinent for adaptation initiatives. However, locations for adaptation infrastructure are probably easier to identify (such as sea walls in low-lying cities, or flood reduction levees on rivers) compared to renewable energy projects where there might be numerous potential locations requiring a cost-benefit analysis to identify the best one. (Whether different locations create opportunities for corruption would be a useful question for future research.)
Another emergent knowledge gap relates to the extent of infiltration into the climate domain of organised crime networks (OCNs). This is not surprising: criminals ‘follow the money’ and CF investments are large and growing and have been on the OCN radar for decades. For example, a key figure in France’s ‘fraud of the century’ involving carbon tax credits, was an individual who had previously been jailed for value-added tax (VAT) fraud involving phones. While serving a three-year sentence for that crime in 1996, his cellmate (a former solar panel installer) advised him to get out of mobile phones because the future (for fraud) ‘…was in businesses that protected the environment. Solar panels, heat pumps, geothermal energy.’86d79efbc980 The individual became an integral part of an OCN that embezzled 385 million euros of VAT from the French government.
Environmental crime conducted by OCNs is already common in many jurisdictions, so their move into the climate domain was to be expected. For example, OCNs have:
- Worked with border officials to illegally import and resell waste or illegal products into eastern Europe.9c440f046326
- Reportedly been involved in the illegal timber trade in Zambia and Namibia.aff1c7f79e25
- Collaborated with others to defraud France’s Emissions Trading Scheme.78f9a4a3b82f
- Infiltrated wind power programmes in Italy to obtain CF in the form of government subsidies.e86a005c7650
The resources and organisational capacity of OCNs suggest that they could be a major threat to CF-funded action. However, the current extent of OCN involvement and how to respond is poorly understood. More education is needed for public and private investors about the risks posed by OCNs and what to do when criminal involvement is identified. Professional policing organisations, such as Interpol or federal crime agencies, will have to ensure comprehensive data collection about OCNs, and subsequent successful investigation and prosecution.
5. Conclusion: Areas for integrity action
Patterns of CF are evolving rapidly, including ever-increasing amounts of finance, new sources of capital (especially from the private sector), new types of payment, and new directions for investments. But the quantities, forms, directions, and pace of CF delivery are being significantly shaped by non-climate-related factors. These include private actors’ interest in the profit-making potential of climate investments, strategic competition to dominate the green economy, and political skill by some states in attracting CF.
Integrity responses need to keep up with these changing patterns to optimise the chance to achieve climate targets, or to at least slow the crisis and find more time to adapt. However, the role of non-climate-related factors in shaping CF is generating risks for corruption well beyond the scope of donors’ and recipients’ national-level integrity systems. These risks need to be fully understood to ensure that the most effective controls are applied. Understanding which controls are most effective for different risks, requires detailed risk analysis and evaluation of effective controls.
We identify seven areas for action for to address integrity challenges. As this report aims to clarify and generate discussion around evolving risks, the ‘areas for action’ are deliberately broad, rather than detailed recommendations for specific stakeholders. For various reasons, risks related to climate investments are being downplayed or ignored. Frank discussions around jurisdictional risk in particular are needed – including how it intersects with climate action, and the harm that can result if jurisdictional risk is not well-managed, especially to marginalised populations.
The seven areas for action to promote integrity are:
- Continued funding for research into risks and into evaluations of anti-corruption controls is critical to maintain and expand knowledge regarding integrity relevant to CF as it evolves. Such research can create an evidence base for policy and anti-corruption controls.
- Peer-to-peer learning can play an invaluable role in ensuring that lessons about risks and controls are shared. In particular, private investors may be less familiar with how to manage social and environmental risks. The Peer-to-Peer Learning Alliance on Climate Finance Integrity97b689e81607 is an example, but mechanisms are needed that embrace actors beyond international development and public financing – such as the private sector, institutional investors, asset managers, and banks.
- Financers such as multilateral finance institutions may be suited to be intermediaries between public and private actors. They can also play an important role in initiating conversations and peer-to-peer learning across the public and private sectors. These institutions are driven by a quasi-private sector ethos around profit-making, but they also have an understanding of international development objectives. An obvious place to start would be with industry initiatives for ESG investors, such as the Principles for Responsible Investment (whose more than 4,000 members have US$120 trillion in assets under management), Canada’s Responsible Investment Association (which has US$31 trillion in members’ assets under management), or the Responsible Investment Association Australasia (whose members have US$29 trillion in assets under management).
- Another area where CF (separate to development finance – that is, more than 90% of all CF) can learn from ODA, is in monitoring and evaluating climate-related investments. Recalling the DC Solar Ponzi scheme in the USA, such a scam (investment in non-existent solar generators) would be unlikely where ODA-style monitoring and evaluation exists. Such frameworks have been built by donors to detect actions that are not contributing to development goals. This contrasts with the private sector where, as long as they are making profits, participants may choose to ignore whether non-profit objectives are being met (unless they are contractually obliged to do so).
- Some integrity controls may be better performed by the private sector, such as identifying ultimate beneficial owners of investment capital. Many jurisdictions do not require declarations of beneficial owners, and therefore their public institutions are not practised at identifying them. By contrast, businesses familiar with assessing the risks of accepting an investment partner or of a potential merger and acquisition are highly motivated to ascertain reputation and performance. They will undertake due diligence, regardless of regulatory requirements, to identify who is behind the money. Organisations such as the Financial Action Task Force and Association of Certified Anti-Money Laundering Specialists have valuable knowledge about money laundering practices and anti-money laundering controls that could be useful for public sources of CF.
- Industry standards can play an important role in incorporating integrity concerns across sectors critical to the energy transition. The Global Reporting Initiative’s new 2024 standard for companies operating within the extractives value chain, GRI 14: Mining Sector 2024, advances norms of disclosure relevant to integrity and CF, including: mine-site reporting of GHG emissions; how changes in operations in response to climate change contribute to a just transition; and disclosures around contracts, beneficial ownership and payments to governments.9ce454a7d147 The Extractive Industries Transparency Initiative Standard (updated in 2023) can also be used by anti-corruption practitioners, including to support a corruption-free energy transition.
- The climate domain is increasingly attractive for criminal networks due to the sums involved, the incomplete controls, and inconsistent knowledge and response by involved parties when corruption is detected. There is an opportunity to start a conversation between police, other law-enforcement organisations, investors, multilateral finance institutions, donors and recipients about the threats to CF from OCNs.
Annex: Scatterplots of vulnerability to climate change and governance indices
Figure A.1: Vulnerability to climate change,and control of corruption
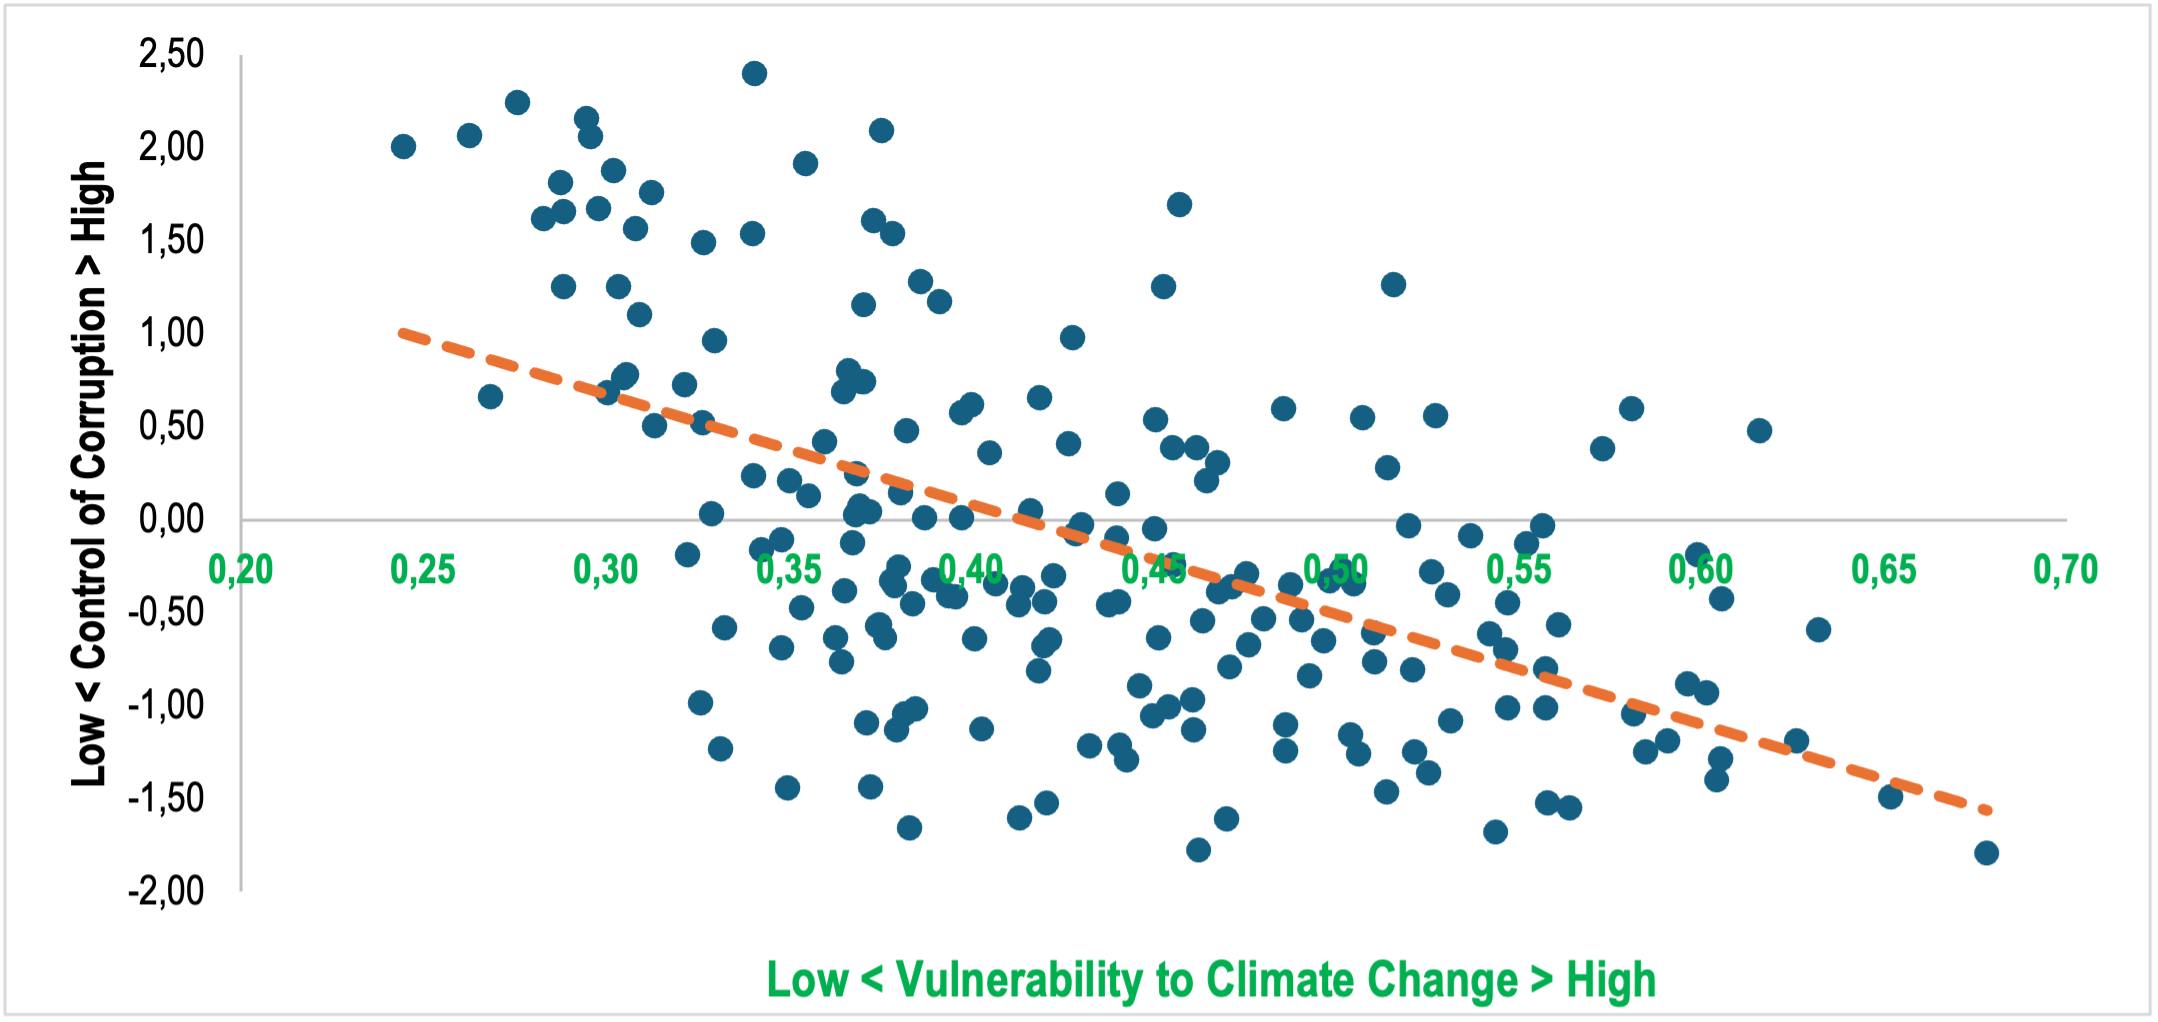
Vulnerability to Climate Change Index (ND-GAIN), and Control of Corruption (COC) Index (World Bank 2022); n = 185; p-value = <.001. Control of corruption has a significant effect on vulnerability to climate change.
Figure A.2: Vulnerability to climate change, and perceived corruption
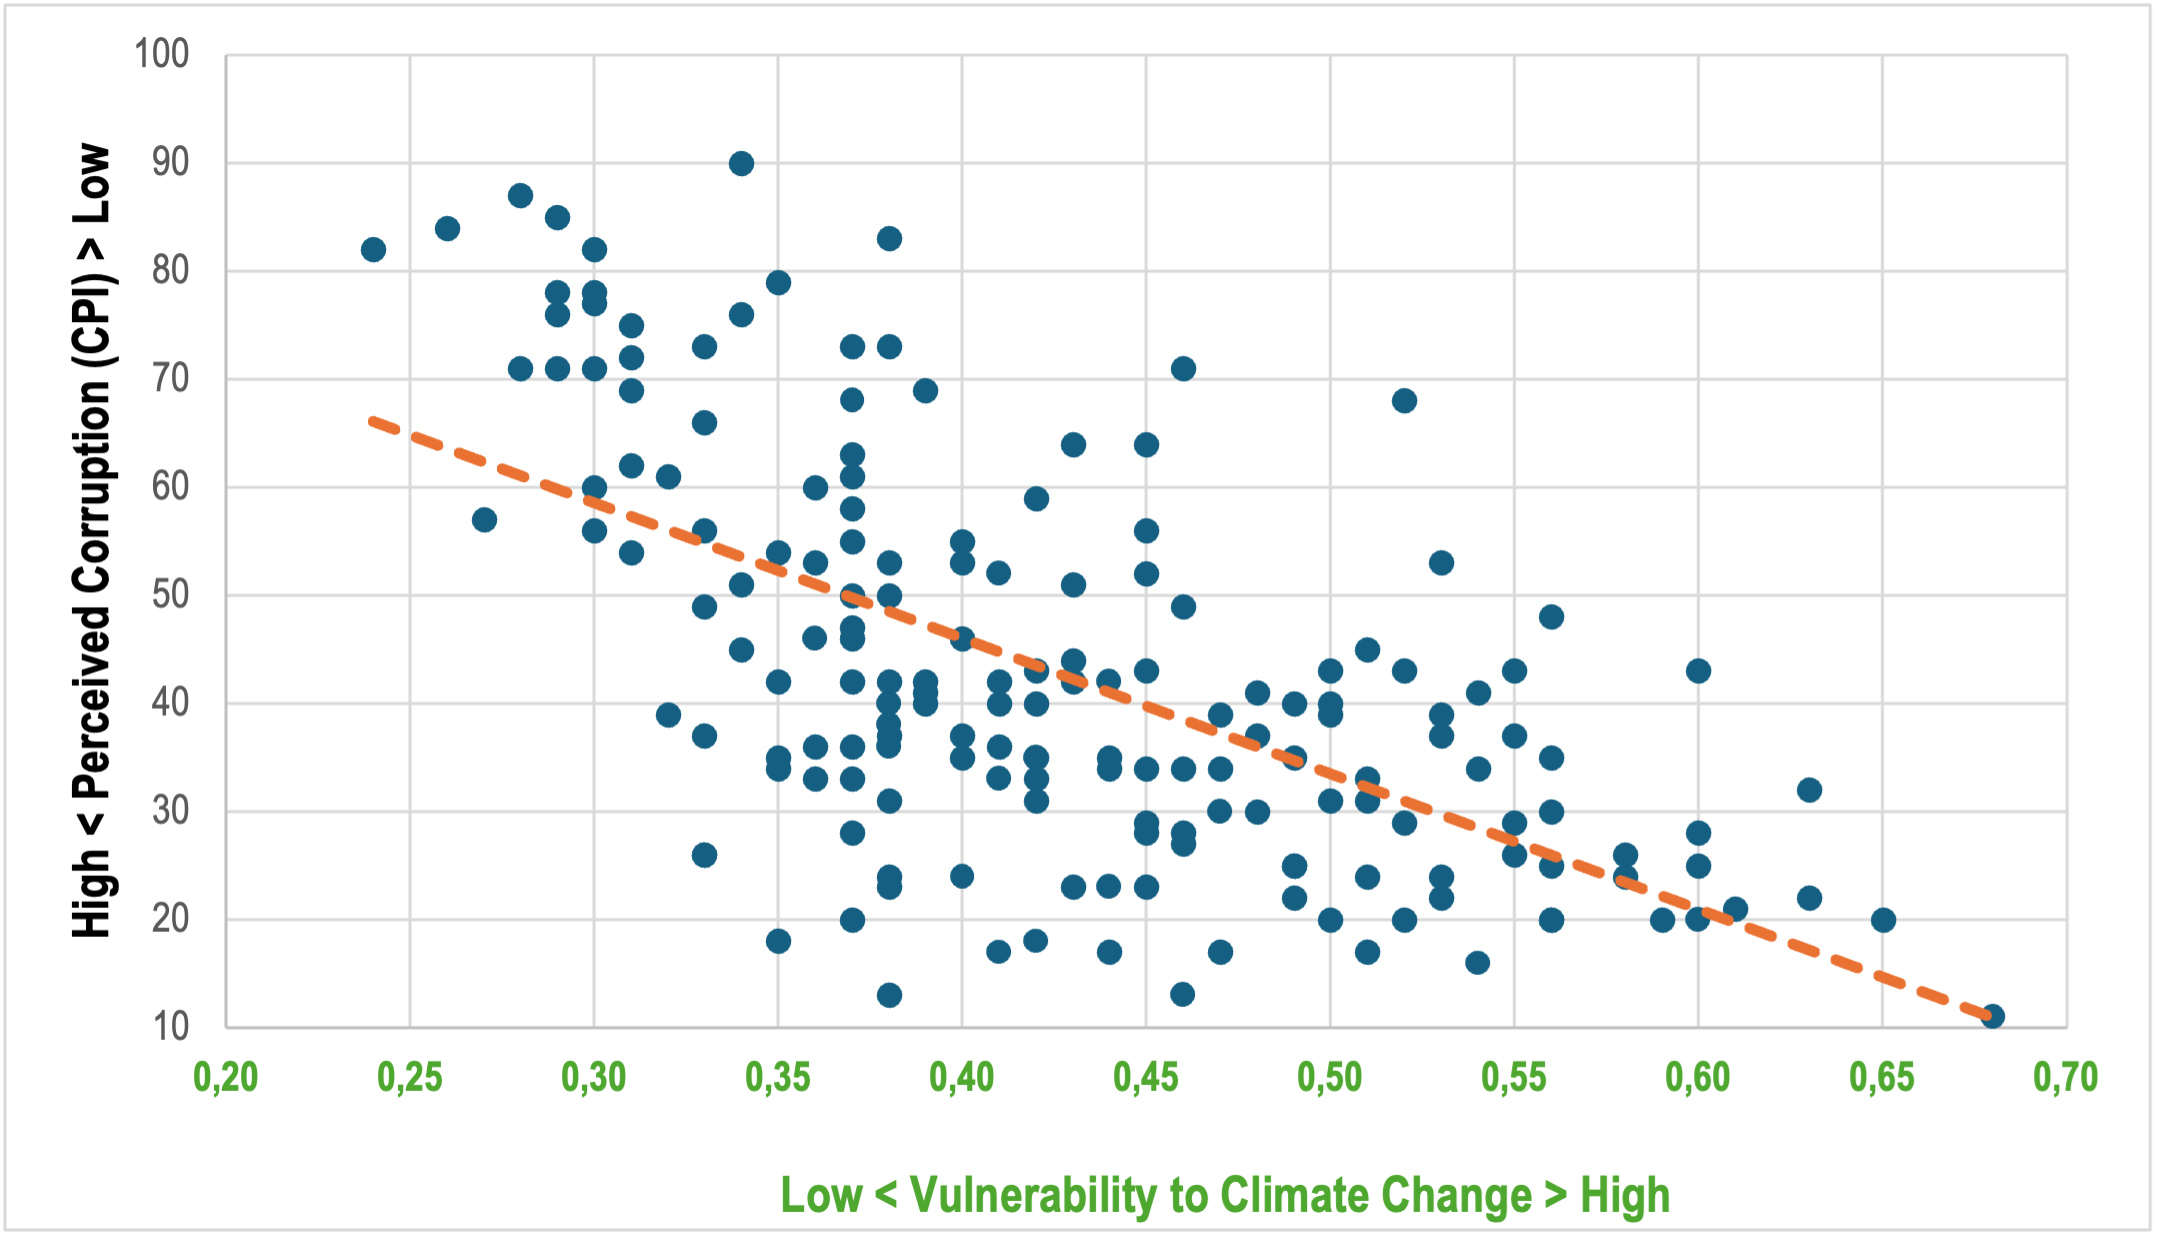
Vulnerability to Climate Change Index (ND-GAIN), and Corruption Perceptions Index (CPI) (Transparency International 2023); n=175; p-value = <.001. Perceptions of corruption has a significant effect on vulnerability to climate change.
Figure A.3: Vulnerability to climate change, and transparency in governance
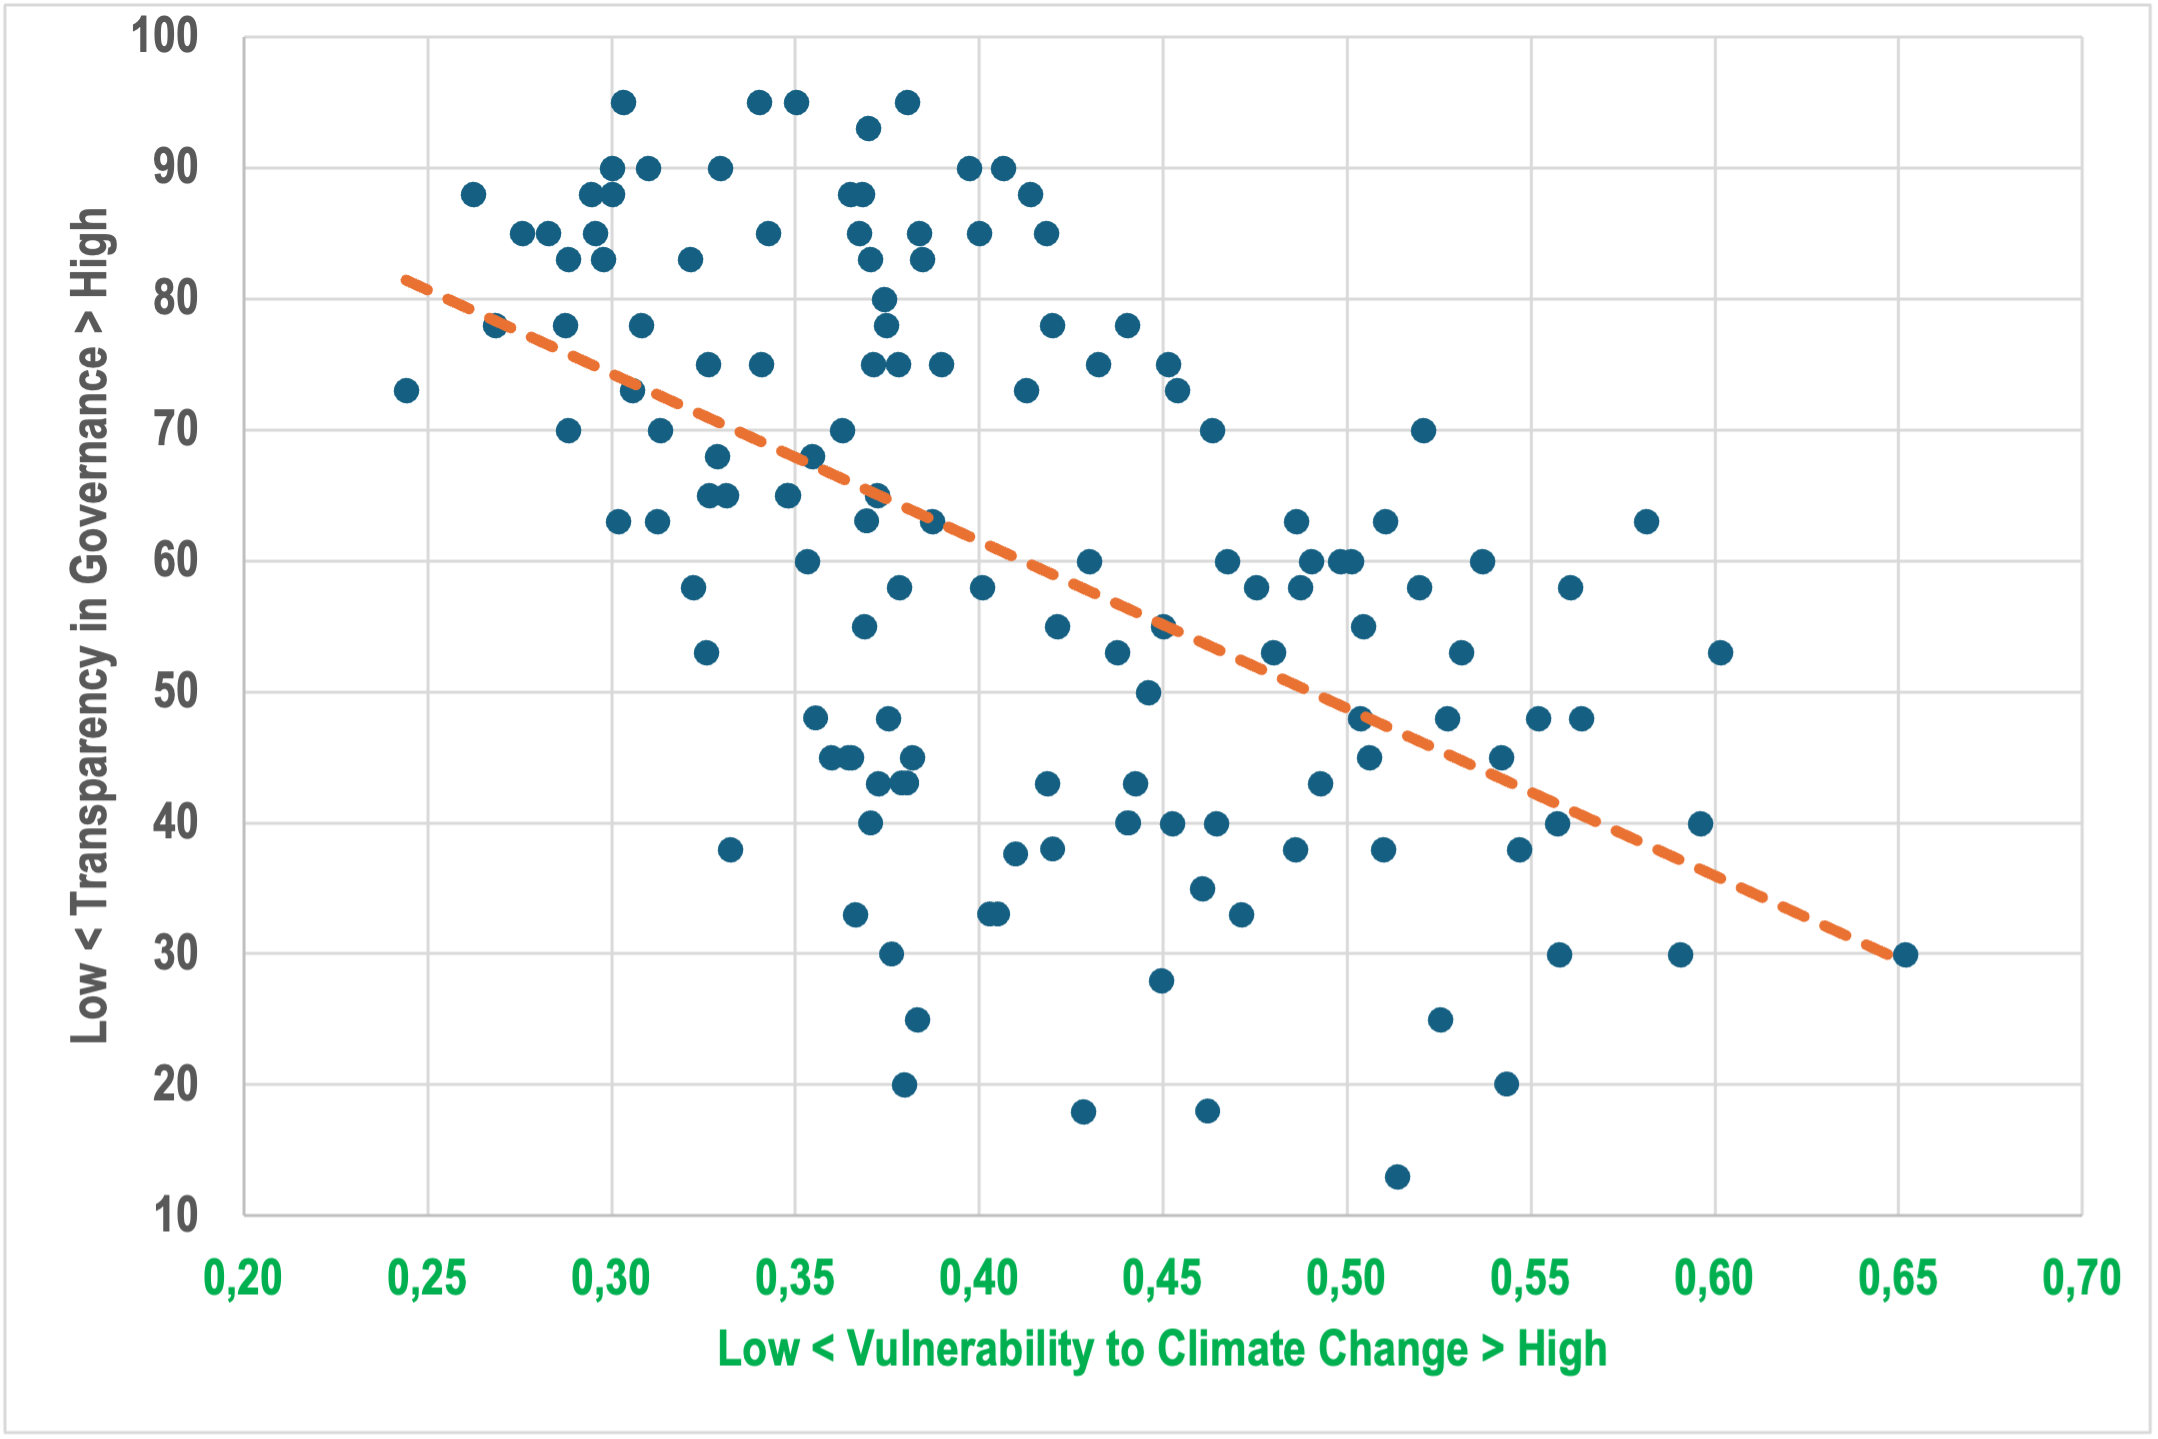
Vulnerability to Climate Change Index (ND-GAIN), and Transparency in governance index (T-Index 2021); n = 139; p-value = <.001. Transparency has a significant effect on vulnerability to climate change.
- Buchner et al. 2023a.
- 1.5°C is the estimated maximum temperature increase at which the negative impact of changes associated with global warming can be contained. IPCC 2018.
- The UN Framework Convention on Climate Change (UNFCCC) defines climate finance as ‘local, national or transnational financing – drawn from public, private and alternative sources – that seeks to support mitigation and adaptation actions that will address climate change.’ UNFCCC 2024.
- Nest, Mullard, and Wathne 2020.
- OECD 2021.
- Buchner et al., 2023a.
- Chen et al. 2023. The ND-GAIN Index has a composite score and ranking for countries based on two factors: (1) vulnerability to climate change; and (2) readiness (to adapt). This report uses only vulnerability scores – not the readiness score, the composite score, or the ranking.
- N=185 for ND-Gain’s Vulnerability to Climate Change Index, so the bottom quintile comprises the lowest 37 scoring countries. Islam et al. (2022) researched the allocation of CRDF to understand if there is ‘distributive justice’ – that is, whether the neediest countries (in terms of vulnerability to climate change) received more CRDF than less needy countries. The authors studied 100,000 climate projects in 133 countries (2000–2018) and found a positive correlation between vulnerability and receipt of climate finance (CF) for adaptation or cross-over purposes, but not for mitigation. However, they also found that countries ‘most vulnerable’ to climate change received less CRDF than ‘moderately vulnerable’ countries. This is supported by the findings of this report: the group of top ten recipients of all CRDF in Table 1 are mostly moderately vulnerable. Collectively, they receive 2.5 times the CRDF of the top LDC recipients, which are mostly significantly vulnerable, as shown in Table 2.
- All three pairings (vulnerability to climate change with each of the three integrity indices) have a p-value of <.001.
- While Indonesia and the Philippines are in the East Asia and Pacific region, China’s overwhelming dominance of this region for receipt of CF means that neither Indonesia or the Philippines can be a significant recipient of CF.
- In 2024, China had 338.9 gigawatts (GW) of capacity under construction out of a total of 530 GW. In second place was the USA with (40.1 GW), Brazil (12.9 GW), UK (9.7 GW), Spain (9.5 GW), Saudi Arabia (8.8 GW), Chile (8.3 GW), and India (7.4 GW) (Global Energy Monitor, 2024). Small-scale solar farms with less than 20 GW capacity were excluded from the study, suggesting that China’s total is likely to be even higher.
- Buchner et al. 2023a: 6.
- World Bank (2023b). For the world’s top GHG emitters, see Climate Watch (2024).
- Bozhenko et al. 2023.
- Mungiu-Pippidi (2022) and Mungiu-Pippidi et al. (2023).
- For example, for fraud in China’s emissions trading scheme and the government’s response see Ministry of Ecology and Environment, China (2022) and Xu & Stanway (2022).
- See Nest et al. (2020).
- See the following for analyses of corruption risks in selected jurisdictions in the Agriculture, Forestry, Other Land Uses, and Fisheries (AFOLU) sector: for forestry in Indonesia see Enrici and Hubacek (2018), and Barr et al. (2010); for land and agriculture in Brazil see Stassart et al. (2021); for forestry and agriculture in Paraguay see Earthsight (2020); for forestry in Peru see PROÉTICA (2021); for forestry in Madagascar see MALINA (2019) and Sharife and Maintikely (2018); for forestry in Namibia see Grobler (2020); for forestry in Zambia see Environmental Investigation Agency (2021); for fisheries in Africa see Standing (2008); for fisheries in the Pacific see Lindley (2023).
- Nyambura 2024. In February 2024, Vestas sold its stake to a fund managed by BlackRock Inc., an American multinational investment company and the world’s largest asset manager (with US$10 trillion in assets under management in 2023).
- The Financial Secrecy Index (FSI) takes into account the size of the financial services sector in determining a jurisdiction’s place on the index. For example, this means that, although Panama is more secretive than the UK, the UK is a far more important destination for offshore wealth, making the UK a bigger supplier of secrecy in practice. The UK therefore is ranked more poorly than Panama on the FSI. See Tax Justice Network (2022) Financial Secrecy Index for their method of calculating the index.
- Nest and Mullard 2021.
- For analyses of the Santa Rita Project, see Climate Diplomacy (2014); Neslen (2017); Filzmoser (2017); and Compliance Advisor Ombudsman (2019).
- Shin and Chung 2011.
- AFP News 2013.
- Lah et al. 2015.
- The authors’ personal communication with G.H. Khairinissa, author of Unpacking the Controversy on the Green Growth Strategy in the Republic of Korea: Case Study of the Four Major Rivers Restoration Project. MSc Thesis, International Development Studies, Wageningen University, Netherlands, 2017.
- Yooh 2014.
- Korea JoongAng Daily 2014.
- Hargrave 2023.
- Sabar 2023.
- Sabar 2023.
- United States Attorney’s Office 2022.
- Sabar 2023.
- United States Attorney’s Office 2022.
- International Energy Agency 2022: 6.
- International Energy Agency 2022: 8.
- United States Geological Survey 2023: 63.
- United States Geological Survey 2024: 125.
- United States Geological Survey 2023: 32 and 133; and for copper Castillo and Caitlin 2022.
- White House 2022; Velez 2023; Teer and Miller 2023; Lu 2023; European Commission 2023.
- It is unclear how new patterns of investments related to critical minerals would be reflected in CF and CRDF data. However, both Buchner et al. and the OECD have ‘Industry’-related sector categories that could include investments in both new processing plants for critical minerals and new production of materials from critical minerals. Manufacturing of components for EVs (a potential investment target for recalibrated supply chains), would fit into the OECD’s ‘Transport & Storage’ sector and Buchner et al.’s ‘Transport’ sector.
- International Energy Agency 2022: 30.
- See Kara 2023. Cobalt is unusual because, unlike other critical minerals that are produced industrially, a large proportion of cobalt is produced by so-called ‘artisanal’ miners working by hand. In Democratic Republic of Congo (DRC), this makes cobalt production commercially viable for two reasons: it is valuable in small quantities; and it is located close to the surface and is sufficiently concentrated to make extraction feasible using low-tech, low-cost methods.
- Extractive Industries Transparency Initiative (EITI) 2024. Global implementation of the EITI Standard. EITI implementing countries. The United States was formerly a member of the EITI, but withdrew. Australia, Canada, Japan, and the USA are all official ‘supporters’ of the initiative.
- Bhandari 2024.
- As of December 2023, US$700 million had been pledged by Denmark, Canada, France, Germany, Japan, Ireland, Italy, Norway, Slovenia, United Arab Emirates, and USA, although this is far less than estimated needs (see Lahkani 2023).
- Harvey 2023.
- Kramer 2022a and Seiler 2023.
- There was some initial concern by South African civil society organisations (CSOs) regarding the Just Energy Transition Partnerships’ (JETPs’) transparency around decision-making and specific supported actions (see Kramer 2022b).
- In 2020, India was the third largest GHG emitter and Indonesia was no. 6, with the other JETPs countries each contributing 1% or fewer emissions of the 2022 global total: South Africa was no. 17 (1.07% of total emissions), Pakistan no. 19, Vietnam no. 20, Kazakhstan was no. 30, the Philippines no. 37, and Senegal no.108 (Climate Watch 2024).
- Buchner et al. 2023; OECD 2021.
- This list is taken from Nest et al. 2020: 4.
- A good example is research on corruption in mitigation and adaptation activities in Bangladesh. See Iftekharuzzaman et al. 2020 and DW 2017.
- The Equator Principles constitute a financial industry benchmark for determining, assessing and managing environmental and social risk. The four banks that withdrew are Citi, Bank of America, JPMorgan Chase, and Wells Fargo. See Lakhani 2024.
- While political pressure to spend CF can generate risks for corruption, research from Bangladesh shows that political associations with a climate initiative does not always lead to, or accelerate, investment. Bae et al. 2022 found that a politician’s association in a climate project reduces positive media coverage, subsequently having a negative impact on investment. It is unclear what role media freedom, politicisation of media, and perceptions of politicians’ integrity may have in shaping this relationship, nor whether such a correlation exists outside Bangladesh.
- Michaelowa et al. 2011: 2.
- Hoffmann 2011; Keohane 2011.
- Buchner et al. 2023a.
- For example, Nest et al.(2022) assess the integrity controls of five climate funds.
- Buchner et al. 2023a: 18.
- Gennaioli and Tavoni 2016.
- Aguirre 2024.
- For cases involving Bulgaria, North Macedonia and Romania, see Environmental Investigation Agency 2021; European Anti-Fraud Office 2020; Cvetkovska et al. 2021; and Organized Crime and Corruption Reporting Project 2021.
- For Zambia, see Environmental Investigation Agency 2019; for Namibia, see Grobler 2020.
- For an example of fraud in the EU’s emissions trading scheme, see France24.com 2018 and Radio France International 2018.
- See Gennaioli and Tavoni 2016.
- The alliance is supported by Transparency International, Germany’s Gesellschaft für Internationale Zusammenarbeit (GIZ), United Nations Development Programme, OECD, and the Green Climate Fund’s Independent Integrity Unit. Information can be found on the Independent Integrity Unit’s website.
- See Global Sustainability Standards Board 2024 for the GRI 14: Mining Standard 2024; and Boyer and Salomon 2023.